Since 2007, when I first got into trading, I’ve had the chance to try out pretty much every trading platform and tool that’s out there. Each one had something going for it—some unique feature or advantage that made it worth using.
But there’s one that really stands head and shoulders above the rest because of its insane versatility and powerful capabilities. As you can probably guess from the article’s title, I’m talking about Sierra Chart.
In this article, I’ll focus on its advantages for manual backtesting and explain why I’m convinced Sierra is absolutely the best choice for this—hands down. I believe that once you discover what it can do, you’ll see my claim isn’t hype at all. Just like me, you’ll realize that manually backtesting on any other platform or tool simply doesn’t make sense anymore.
Here’s a list of reasons Sierra Chart is simply the best software out there for manual backtesting:
The Most Advanced Replay Tool on the Market
Thanks to its incredibly powerful replay tool combined with true tick-by-tick historical data, Sierra Chart can replay market events exactly as they happened in real time.
You can open as many chart windows, DOMs, Time & Sales, or Level 2 windows as you want and practice or manually backtest in an environment that feels identical to live trading.
All of them stay perfectly synchronized throughout the entire replay — even when you’re working with massive tick-by-tick data files.
The replay tool itself is seriously sophisticated and gives you total control over how the historical data plays out. For example, you can jump forward or backward by time, by number of trades, or to the next bar. You can slow it down, speed it up dramatically, choose exactly which windows get replayed, and switch between different playback modes.
You simply won’t find this level of flexibility and precision on any other platform.
Highly Realistic Trading Simulator
When it comes to realistic market simulation, Sierra Chart stands in a league of its own.
You can create up to 1,000 separate sim accounts for paper trading with live or delayed data, or for manual backtesting on historical data using the Replay Chart feature. These sim accounts give you the full trading experience — you get full order history, a clear view of open positions, detailed trade activity logs, performance stats, and everything else you’d expect.
Trading in these sim accounts feels highly realistic. You get access to every order type you’re used to in live trading (market, limit, stop, trailing, OCO, attached/bracket orders), so testing different trade management techniques is seamless.
But here’s what really separates Sierra Chart from everything else: it actually simulates slippage, partial fills, and order queuing. That’s a game-changer if you want your backtests and sim trading to closely mirror real-world conditions.
Replay of Various Bar Types
Sierra Chart lets you replay any bar type the platform supports.
This means you’re not limited to testing only strategies that rely on time-based bars. You can also explore setups that use alternative bar types, such as:
- Tick Bars
- Volume Bars
- Range Bars
- Reversal Bars
- Renko Bars
- Delta Volume Bars
- Point & Figure Bars
- Heikin Ashi Bars
- Kagi Bars
- Number of Trades Bars
That kind of flexibility opens up entirely new possibilities for strategy development and backtesting.
Flexible Multi-Chart Layouts
One of Sierra Chart’s biggest strengths is the total freedom it gives you with multiple windows. Not only does the platform impose no limits on the number of chart windows, DOMs, Time & Sales, or Level 2 windows you can have open, but it also lets you arrange them exactly the way you want.
This is a massive advantage over other backtesting platforms like TradingView, FX Replay, or Forex Tester, which lock you into rigid, pre-designed layouts with strict limits on how many windows you can use at once.
On top of that, Sierra Chart lets you detach any window from the main interface and drag it to a second (or third) monitor. That unlocks virtually unlimited setups for intermarket analysis and multi-timeframe work—something that’s almost impossible to do effectively when you’re stuck with just a handful of windows.
Extreme Customization Options
Sierra Chart is hands-down the most customizable trading platform on the planet.
Yeah, that sounds like marketing hype, but in this case it’s actually true.
You can tweak literally every single element — down to the smallest detail — until it fits your exact workflow and looks exactly the way you want. The workspace layout, hotkeys, control bar buttons, order types, chart colors, fonts, tool behavior, mouse interactions, and right-click actions — pretty much anything you can imagine is customizable.
This is what truly sets Sierra Chart apart — nothing else even comes close.
Huge Number of Built-in Indicators
If your trading approach relies on technical indicators, you’re going to love this.
Sierra Chart comes with over 470 built-in studies plus several hundred more from the user community. You’ll find all the classics — Moving Averages, MACD, RSI, CCI, Bollinger Bands, ATR, and OBV — as well as powerful advanced tools like Volume Profile and VWAP.
Every single one is highly customizable. You can combine multiple studies, layer them, base one study on another, set alerts on virtually anything, or export their values straight to a spreadsheet.
And if you need something that doesn’t exist yet, you can code your own using ACSIL (C++) or build it right inside the platform’s built-in Excel-compatible spreadsheet.
Professional Order Flow Tools
For traders who are serious about order flow, Sierra Chart is literally a dream platform.
Here’s a quick rundown of the key tools you’ll actually use:
- Numbers Bars (Footprint Charts)
- TPO / Market Profile
- Volume by Price (Volume Profiles)
- Market Depth Historical Graph
- Cumulative Delta
- Bid/Ask Volume Difference (Volume Delta)
- Advanced DOM with clear pulling & stacking visualization
- Time & Sales with powerful filtering
The best part? All of these tools work flawlessly, even during replays with historical data. That means you can manually backtest pure order-flow setups exactly as you would trade them live.
Deep Historical Data
Whether you’re backtesting a strategy on futures, forex, stocks, or cryptocurrencies, Sierra Chart gives you access to a comprehensive historical dataset perfect for replay.
This high-quality tick-by-tick data is downloaded from Sierra Chart servers and then stored on your hard drive, so you can run analysis and backtests even when you’re completely offline. This is another massive advantage over many competing platforms that force you to stay connected at all times.
Historical market data is available for a huge variety of markets. But if you prefer to use your own data, that’s no issue at all. Just copy your data files into the Sierra Chart root folder, load them up, and you’re ready to start analyzing or replaying the market right away using the Replay Chart feature.
Easy Export of Backtesting Data
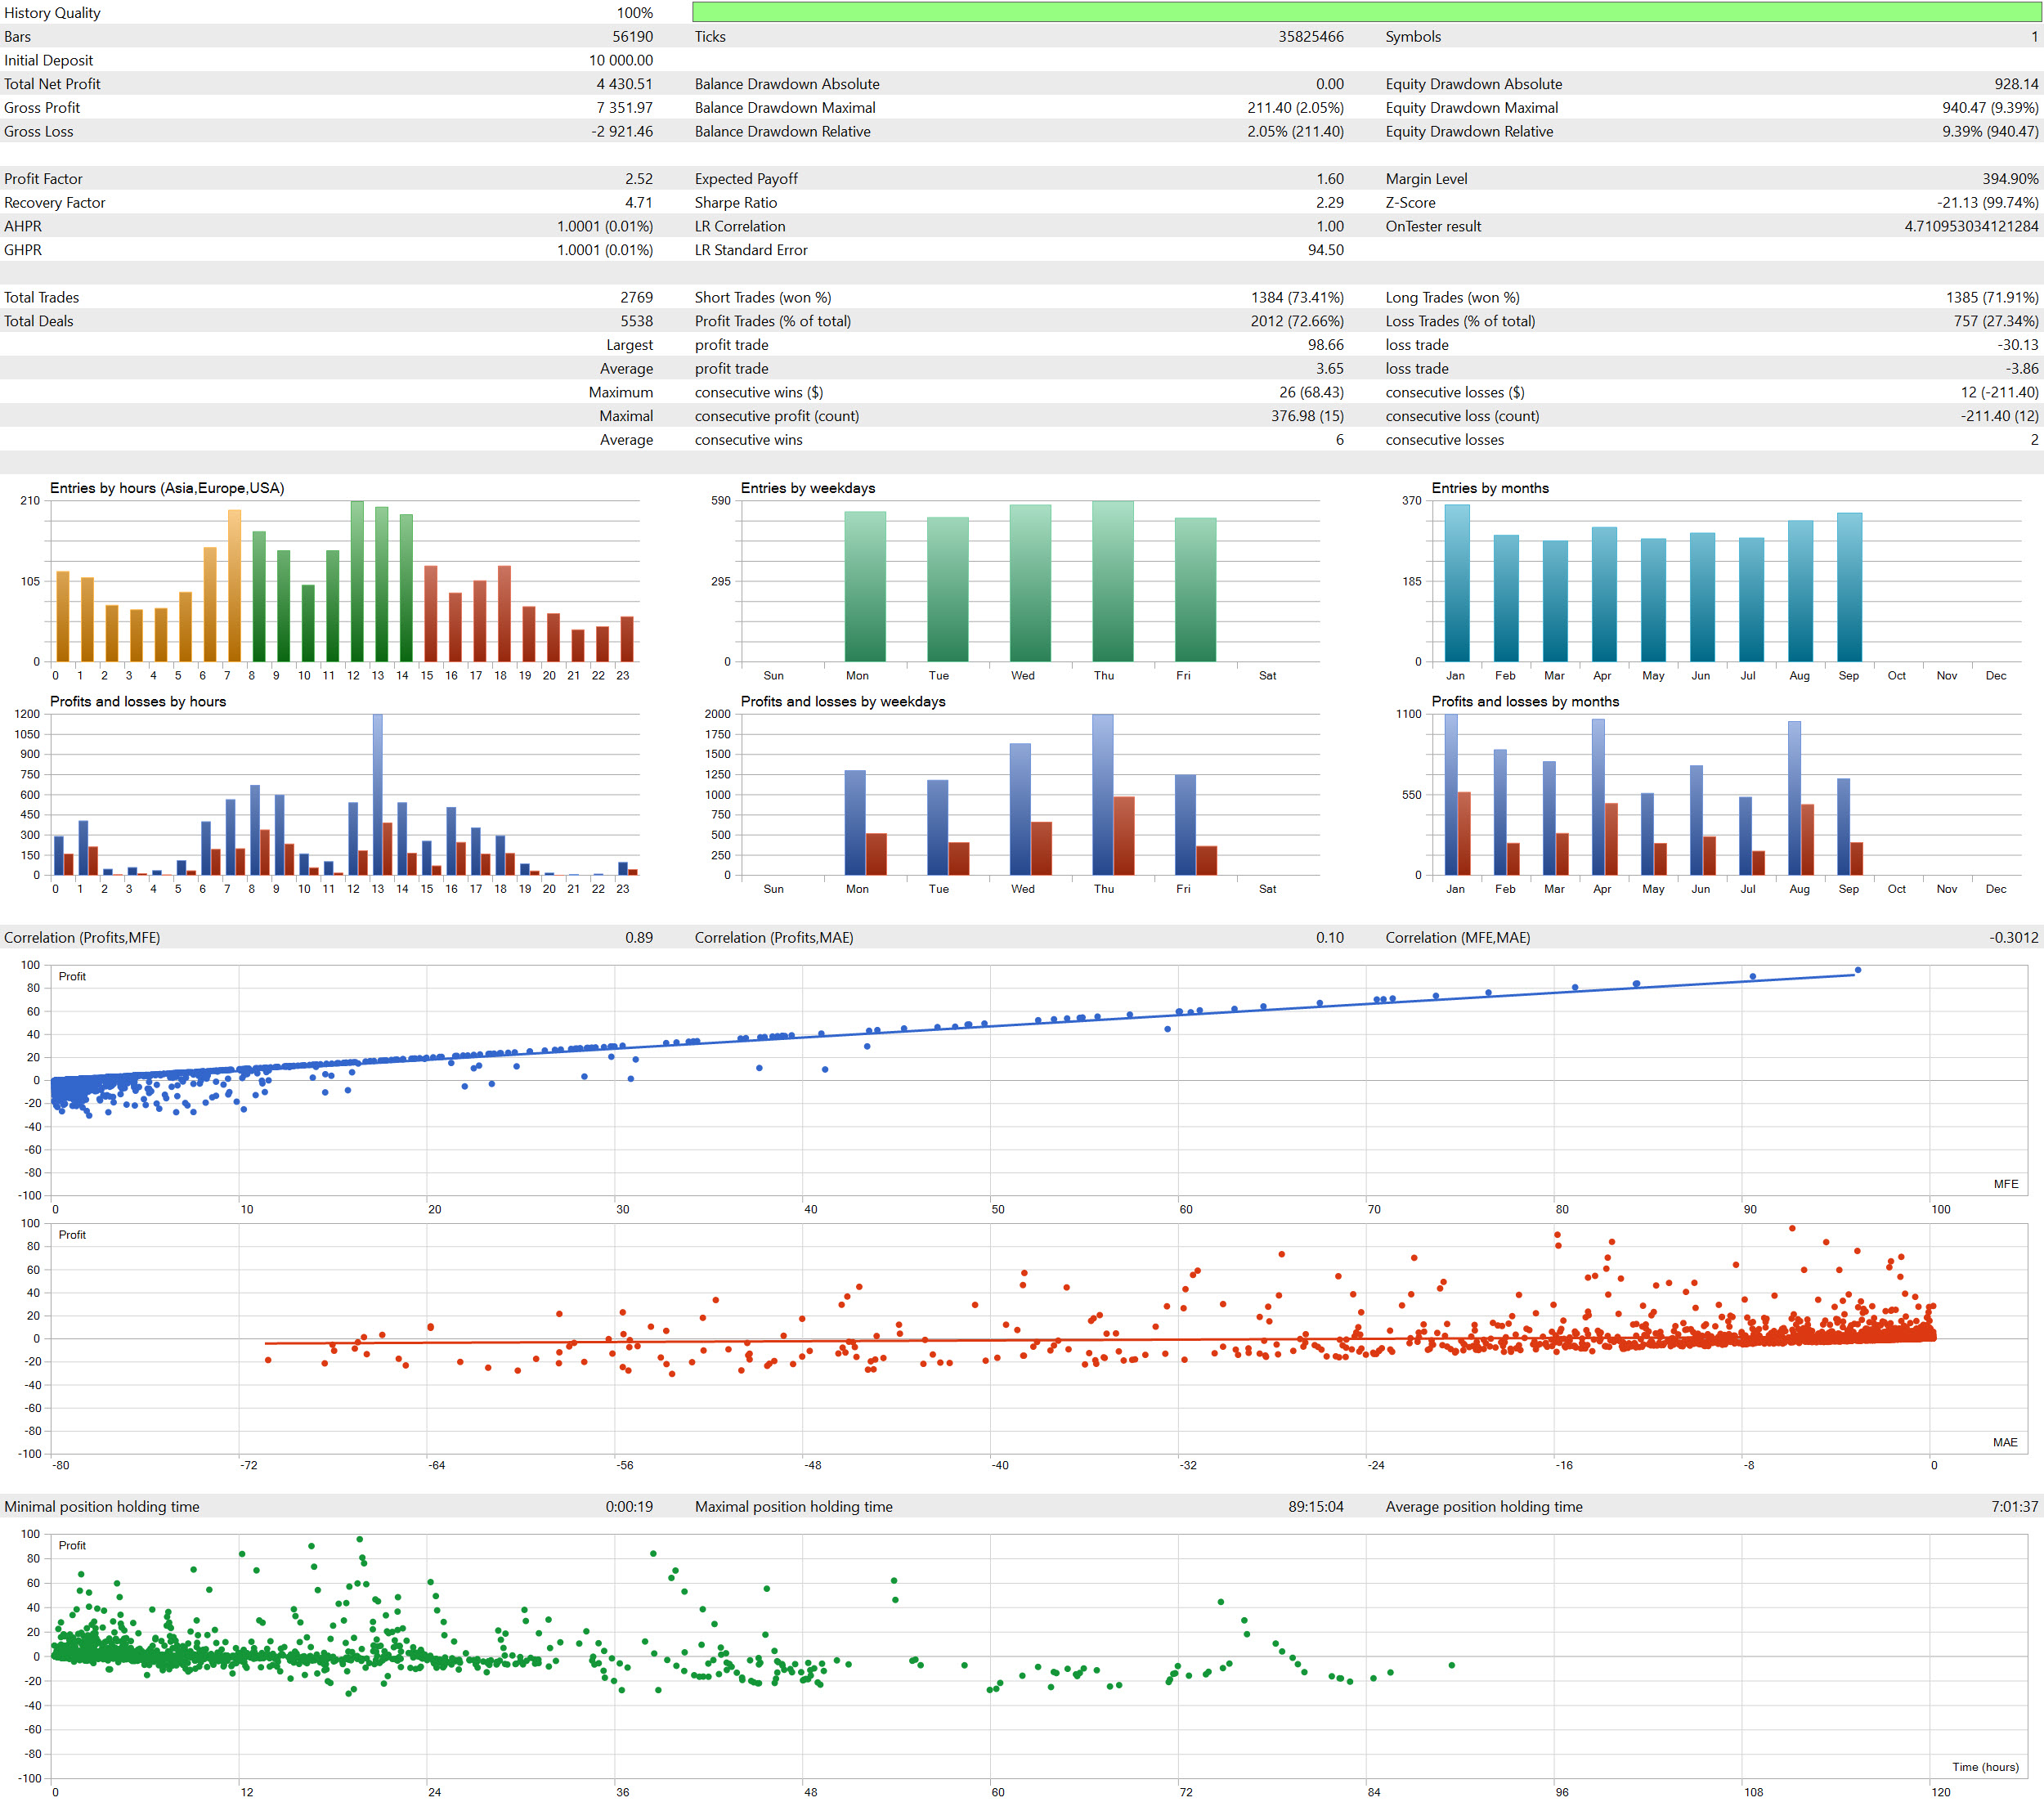
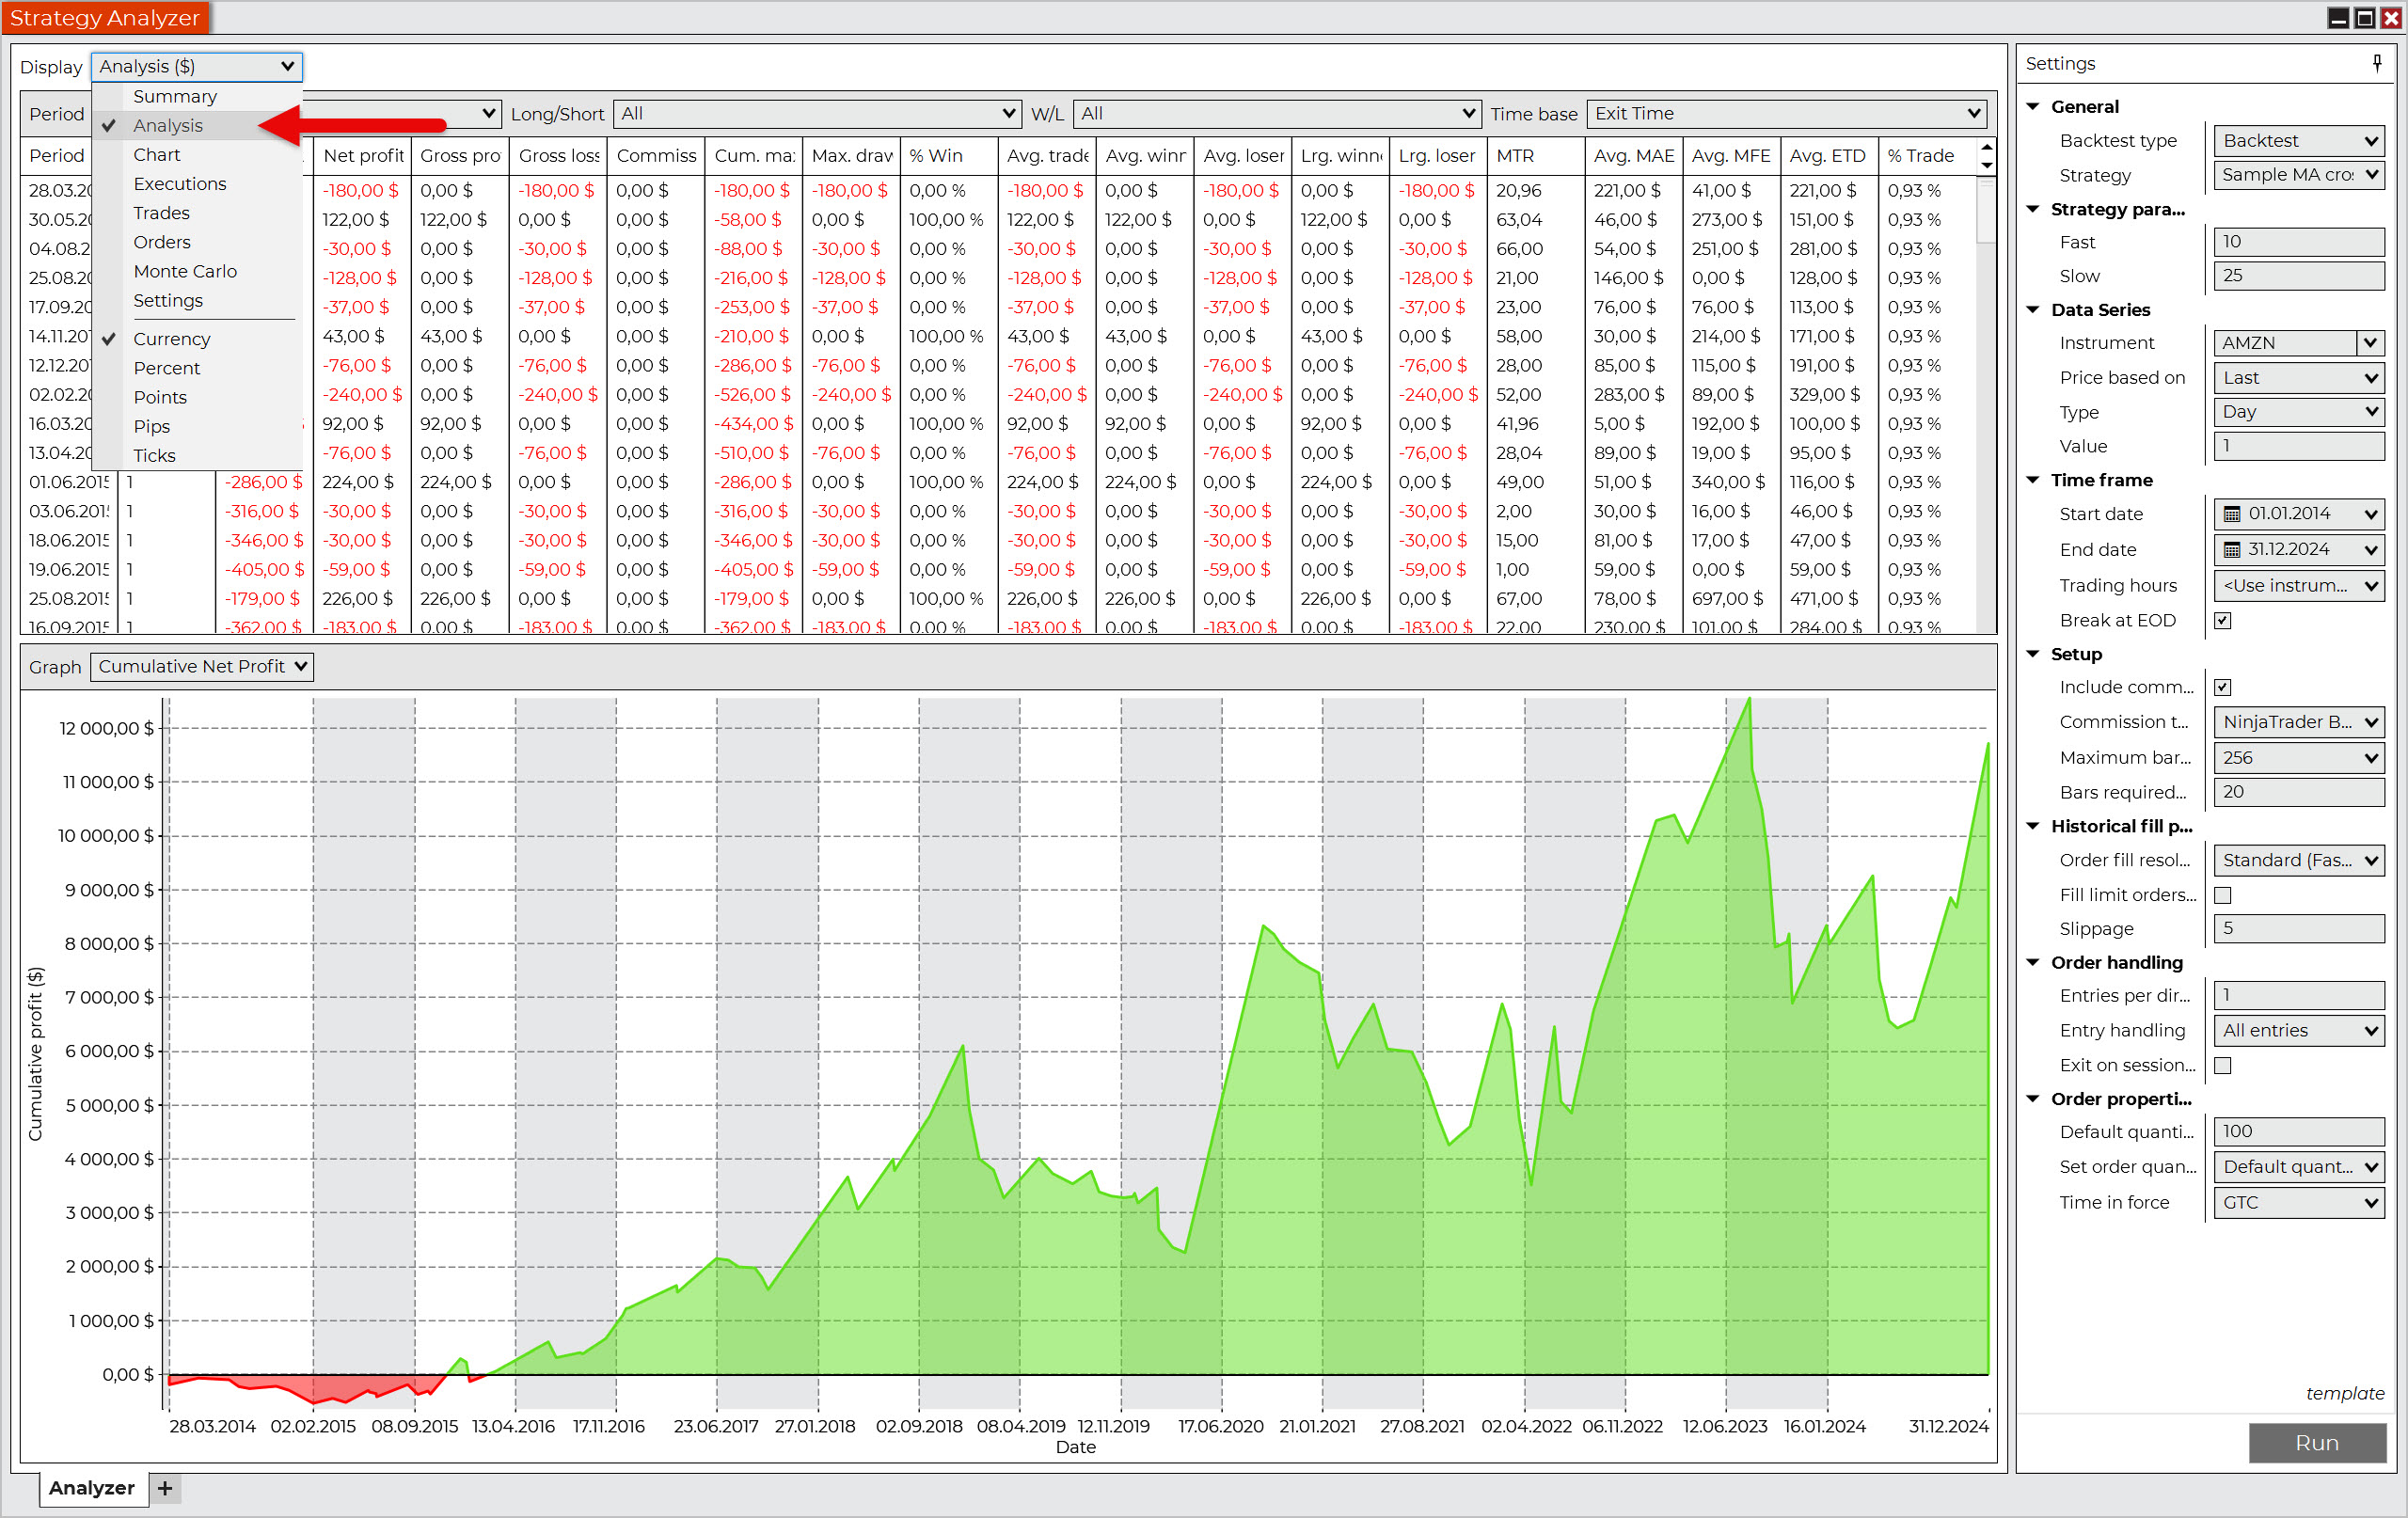
Whether you’re paper trading with real-time or delayed data, or running backtests with replay, Sierra Chart automatically logs all your activity and displays it in the Trade Activity Log.
There, you can review detailed information on executed trades, open and closed positions, orders (placed, filled, or canceled), performance statistics, and more.
Even better, you can export the data to a CSV or text file with just a few clicks and analyze it further in Excel or Google Sheets. For example, you can import it straight into the Backtesting Club Trading Journal to get in-depth statistics plus clean, professional-looking charts that visualize your trading performance.
Exceptional Affordability
Here’s the best part.
With everything Sierra Chart can do, you’d think you’d have to pay a fortune for it. But it’s actually the complete opposite.
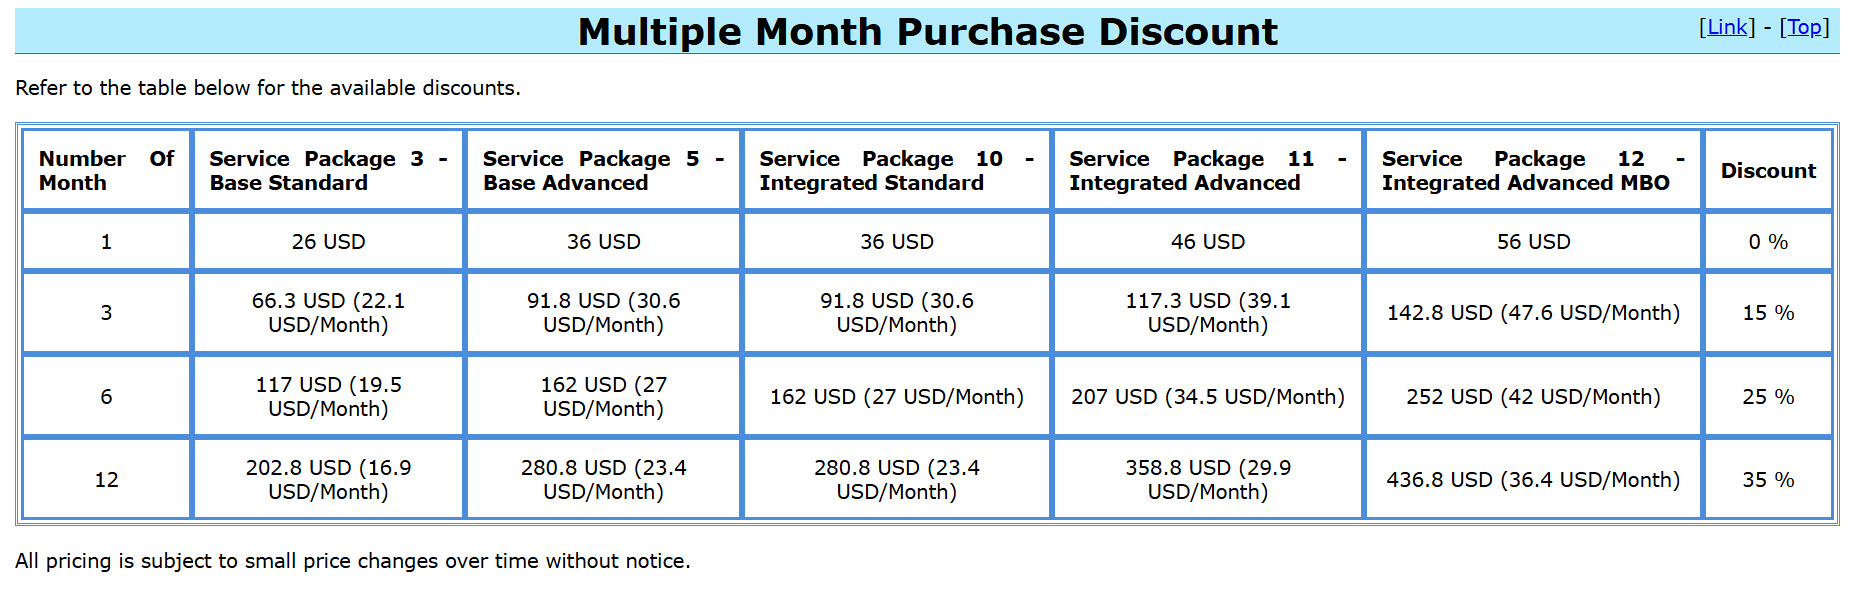
For paper trading and backtesting, Sierra Chart gives you two very affordable base packages:
- Service Package 3 → $26/month
- Service Package 5 → $36/month
Package 3 unlocks basically the entire platform, except for four key studies: TPO Profile, Numbers Bars, Numbers Bars Calculated Values, and the Market Depth Historical Graph. Those are included in Package 5 — just $10 more per month if you want them.
Plus, the monthly price already includes a wide range of high-quality tick-by-tick historical data and delayed market data. You don’t need to pay extra for a separate data feed just for charting and backtesting. That alone can easily save you $70–$110 per month compared to buying a similar range of data from providers like IQ Feed, Barchart, or dxFeed.
And if you want to save even more, pay for multiple months upfront. With Package 3, you can get the effective monthly price down to as low as $16.90, which is an absolute steal for what you’re getting.
On top of that, if you ever want to upgrade, downgrade, or try something different, switching packages is incredibly easy, and there’s no fee or penalty. What other trading platform lets you do that?
Conclusion
Now you know all the key advantages that make Sierra Chart the best platform for serious manual backtesting and paper trading on live or delayed data.
If you’ve been paying attention, it should be pretty clear why using anything else for this just doesn’t make sense. No other platform comes close in terms of accuracy, realism, and flexibility.
That said, to be fully transparent, there is one real drawback. Because Sierra Chart is true professional-grade software with an insane level of customization and settings, it comes with a steep learning curve. You’re not going to install it and be a pro in a few hours.
This isn’t TradingView — it’s not built for casual retail traders who want everything spoon-fed. Expect to invest a few weeks to really learn the platform and dial in your setup the way you want.
However, if you don’t want to waste months figuring it out on your own, I’ve put together the Sierra Chart Mastery Course.
With it, you can go from beginner to confident user in just a few days. You’ll also pick up dozens of powerful tips and tricks that you’d probably never discover digging through the official documentation alone.
And if you ever get stuck, you can jump into our private Backtesting Club Discord and ask questions anytime.
So it’s totally up to you: grind through the long, frustrating way… or take the shortcut.
Either way, once you get past that initial learning phase, you’ll have one of the most powerful tools in the industry at your fingertips. And I’m confident you won’t want to use it just for backtesting and sim trading — you’ll want it for your live trading too.