How to Backtest a Trading Strategy
The Ultimate Guide to Automated and Manual Backtesting
Table of Contents
Congratulations! The fact that you have landed on this page shows that you are serious about your trading. Believe it or not, you have already done more than 90% of novice traders who will never learn how to backtest a trading strategy.
Trading is a business like any other. It rewards diligent, hard-working, and disciplined individuals who have conducted superior market research. However, compared to traditional business, trading offers one major advantage: the opportunity to test our strategy before risking a single dollar in the market!
In this backtesting guide, you’ll discover practical steps to simulate your trading strategy against historical data, identify its strengths and weaknesses, and optimize it for better performance. Whether your focus is on stocks, forex, futures, or crypto, these methods will help you evaluate your approach objectively, allowing you to trade with greater confidence.
What is Backtesting in Trading
Backtesting is the process of testing a trading strategy on historical market data to see how it would have performed in the past. Its goal is to determine what results the strategy delivers in different market conditions and whether it has the potential to generate long-term profits.
The idea is straightforward: If I had traded this way before, how much money would I have made or lost?
Many novice and even advanced traders mistakenly believe that backtesting is something that only needs to be done at the beginning of their career, while they are still searching for a profitable trading strategy. However, nothing could be further from the truth.
Professional traders use the skill of testing strategies on historical data throughout their entire career. This is because there is always a new trading idea around the corner that needs to be tested. Backtesting is, therefore, not just a chapter in a trader’s life, but an essential part of it.
Reasons for Backtesting
If you haven’t started backtesting yet, here are some good reasons why you should.
Finding a Profitable Trading Strategy
This is where every trader starts. If you don’t have a well-defined and tested trading strategy, then you’re not a trader, you’re a gambler. For this reason, you shouldn’t even think about implementing any new strategy before you’ve thoroughly backtested it. After all, you only want to trade strategies that give you the highest chance of increasing your account value, right?
A significant advantage of the internet (and also a disadvantage) is that, with a bit of searching, you can find a ton of backtestable strategies. Just go to YouTube or Google and enter one of the following phrases in the search box:
- Strategy backtested
- Backtesting results
- Backtested results
- Proven strategy
- Live backtesting
- Backtesting session
- Backtesting [Your Market]
- High win rate strategy
The research phase will probably take you a few days, but it’s definitely worth it. The chances of finding something really interesting are very high.
From the options you find, select strategies that have clearly defined rules for entries, exits, and stop loss placement. On the other hand, avoid all trading strategies where the author emphasizes the need for experience, even if they otherwise seem very promising. Thanks to this simple filter, you can actively prevent situations where you get stuck during backtesting due to vague strategy rules.
Replacing Your Current Trading Strategy
Another good reason to backtest is when your existing trading system is not delivering the results you expected, leading you to consider replacing it.
This is a totally legitimate approach. However, before you abandon your existing trading system completely, test it again and ensure that you have executed it exactly according to your trading plan.
Open your trading journal and identify the period in which your strategy did not perform well. Then backtest your current trading strategy for that period. If the backtesting results truly match the real trades, it’s time to seek a more effective strategy.
Diversify by Incorporating a New Trading Strategy
In case you’re part of the small group of lucky traders who’ve already found their winning strategy, you should think about adding another one to diversify your trading.
For instance, if you have a successful intraday trading system, consider incorporating a swing strategy. This allows you not only to accelerate the growth of your trading account but also to achieve diversification, which leads to a reduction in drawdowns.
Only a backtest can give you the answer to how much your trading results can improve.
Improving Existing Trading Strategies
Your current strategy generates regular profits and delivers consistent results. Great! However, have you ever asked yourself if it could be even more profitable? What if you are only using 50% of its potential? What if you could significantly reduce its drawdown? To answer questions like these, you need to incorporate backtesting into your workflow.
A small change in strategy parameters can lead to significant extra profits that you would normally leave on the table. But you’ll never know unless backtesting becomes a regular part of your trading review process.
And where in the strategy should you look for changes? Here are a few tips on parameters that can be modified:
- Time frame
- Market
- Indicator period
- Stop loss size / Stop loss placement
- Profit target size / Target placement
- Session
- Entry logic
- Exit logic
The strategy can be further improved by adding a new element, such as a time stop loss, an entry or exit filter, and so on. There are endless possibilities for backtesting, and it is up to you to decide which direction to go.
Experience Accelerator
If you are a beginner or an unsuccessful trader, pay attention now.
Backtesting allows you to gain experience up to 60 times faster than regular paper trading (demo trading). This gives you a significant advantage over everyone else who ignores this activity.
An experienced backtester can typically test their trading system on up to 60 trading days during a single trading session (approximately 6 hours). That means a speed of approximately 10 trading days per hour. By simple deduction, you can therefore determine that in four to five days, they can gain data and experience equivalent to that of an entire year!
Do you know of any other field where you can make such giant strides in such a short time? Incredible, isn’t it?
Foundations of Backtesting
Before we delve into how backtesting works in practice, it is helpful to understand its place within the broader process of strategy development or enhancement.
Typical stages in the development of any trading strategy:
- Backtesting: Testing your rules against historical data.
- Forward testing: Applying the strategy on live data in a demo account, also known as paper trading.
- Live trading: Running the strategy with real capital in a real market environment.
The workflow usually looks like this:
- Defining a trading idea.
- Transforming it into clear rules.
- Applying those rules to past data.
- Measuring the strategy’s performance.
- Refining or rejecting the trading strategy.
To get started, you’ll need four things:
- Trading platform with backtesting capabilities, a backtesting platform, or a code editor and so-called libraries
- Historical price data
- Structured trading plan with clear entry, exit, and risk management rules
- Backtesting spreadsheet
This guide covers all of the above in more detail later. However, before moving on to those topics, you first need to familiarise yourself with backtesting methods and understand their advantages and limitations.
Backtesting Methods
There are two approaches to testing trading strategies:
- Manual backtesting: testing trades by hand, usually scrolling through historical charts or replaying them and recording hypothetical results.
- Automated backtesting: programming your rules into software that runs the tests quickly and objectively.
A professional trader should be able to use both methods, as each has different advantages. Therefore, we will discuss their possibilities in depth, starting with manual backtesting, which is easier for most novice traders to apply.
Manual Backtesting of Trading Strategies
There are three ways to perform a manual backtest:
- Candle-by-candle chart-revealing method
- Replaying charts with 1-minute data
- Replaying charts with tick-by-tick data
The decision about which one to use depends on the complexity of your trading strategy.
Candle-by-Candle Chart-Revealing Method
This is the simplest and oldest method of backtesting. It is suitable for testing simple strategies that use only one time frame.
The process typically looks like this:
- Pick a market and timeframe (for example, EURUSD, 5-minute chart).
- Scroll back several months or years so you can’t see the most recent price action.
- Move forward one candle at a time.
- When your setup appears, log the trade in your backtesting spreadsheet, including the entry level, stop-loss level, exit level, and result.
- Continue through the dataset until you’ve gathered a meaningful sample (at least 50 trades).
- Analyse your results: win rate, average trade, profit factor, drawdowns, etc.
A significant advantage of this method is that it doesn’t require any specialised or expensive software. Therefore, a trader can use any standard charting platform that provides a sufficient sample of historical data.
A practical demonstration of how to apply the candle-by-candle chart-revealing method is illustrated in the article “How to Backtest a Trading Strategy on MetaTrader 5.”
Replaying Charts With 1-Minute Data
Currently, this manual backtesting method is the most popular way traders use to develop and improve their trading strategies.
It differs from the previous method primarily in how the chart is scrolled. Instead of shifting the chart manually, candle by candle, the software does this job for you using a so-called replay tool. Thanks to this, it is also possible to work with multiple windows at once, which allows the trader to test strategies using multi-time frame and intermarket analysis. And that’s a huge advantage!
If you want to see how the replay tool works in action, check out the article “How to backtest a trading strategy on TradingView“, which summarizes the backtesting options of the world’s most popular trading platform.
Replaying charts with 1-minute data means that the software only has access to the following information:
- Open: opening price of a 1-minute candle.
- High: the highest price of a 1-minute candle.
- Low: the lowest price of a 1-minute candle.
- Close: closing price of a 1-minute candle.
- Volume of a 1-minute candle.
It cannot display charts with lower time frames, such as a 15-second chart, because it lacks the data to do so. This is not a problem for backtesting positional, swing, and most intraday strategies, which usually only require 1-minute data. However, suppose you want to test complex and sophisticated strategies. In that case, you cannot do without a trading platform equipped with a replay tool and historical tick-by-tick data.
Replaying Charts With Tick-by-Tick Data
Let’s start by explaining what tick-by-tick data actually is and why it is so indispensable for backtesting many strategies.
Tick data is the most granular form of market data. Each “tick” is a record of a single event in the market, usually a change in bid/ask prices or an actual trade. Thanks to this, the trading platform can reconstruct the exact sequence of events and replay them as if it were connected to live data. This provides traders with a realistic trading simulator that they can use not only to backtest trading strategies, but also to hone their trading skills and quickly gain experience.
If the historical tick-by-tick data is of high quality, then the chart should look the same as it would with live data. Here you can see an example of a comparison of charts drawn using live and historical tick-by-tick data.
Can you see it? No significant difference! This is exactly what you would expect from a real trading simulator.
Now that you understand the usefulness of tick-by-tick data, let’s talk about where it can be used.
As you have probably already understood, testing strategies using a replay tool and historical tick-by-tick data is the highest, but also the most time-consuming form of manual backtesting. We apply this method to strategies that use one or more of the following elements:
- Second or tick charts.
- Alternative charts such as Renko, Range Bars, Heikin Ashi, Footprints (Number Bars), and the like.
- Special indicators such as volume at price (volume profile), cumulative delta, volume delta, and the like.
If you have been interested in trading for some time, you should quickly realize what these elements have in common. They are heavily used by scalpers.
Historical tick-by-tick data is an absolute necessity if you want to accurately backtest sophisticated scalping strategies such as various momentum and breakout trading systems. By backtesting in this way, traders not only obtain data about their strategy but also learn to perceive market movements, which is absolutely crucial.
Tick-by-tick replay is a special feature offered by only a few trading platforms and backtesting tools. One of them is Sierra Chart, which also provides many other useful features, making it the preferred platform in our Backtesting Club. However, if you are curious about what other platforms and tools can handle tick-by-tick replay, check out the backtesting software overview page.
Advantages of Manual Backtesting
- Deep learning: You get to see the market move candle by candle, which builds intuition.
- Flexibility: Easy to test discretionary or “fuzzy” rules (e.g., “only enter if price looks strong,” which is hard to code).
- Low barrier: All you need is a charting platform and a backtesting spreadsheet.
- Refinement: Ideal for developing and refining early ideas before undergoing deeper testing.
Drawbacks of Manual Backtesting
- Time-consuming: Testing hundreds of trades across years of data can take days or weeks.
- Human error: Easy to misapply rules or make recording mistakes.
- Bias: Knowing the future price can tempt you into “cheating.” This is called look-ahead bias.
When Manual Backtesting Makes Sense
Manual backtesting is especially useful if:
- You’re a beginner, building your first system.
- Your strategy has discretionary elements that cannot be easily coded.
- You want to learn price action patterns deeply.
- You don’t yet have programming skills, but want to test ideas.
Automated Backtesting of Trading Strategies
When your strategy has clear and strict rules, you can use fast automated backtesting instead of slow manual backtesting.
Rather than stepping through charts by hand, you encode your trading rules into software and let the computer run the tests for you. The program applies your rules consistently, trade after trade, across years of historical data.
The main benefits? Speed, accuracy, and scale.
How Automated Backtesting Works
The general workflow looks like this:
- Defining rules: Entry logic, stop loss placement, exit rules, and position sizing.
- Code creation: Either by writing code or using strategy builders.
- Running the backtest: The backtesting software applies the rules to historical price data.
- Analyzing results: The program generates detailed statistics (metrics) such as win rate, profit factor, max drawdown, Sharpe ratio, equity curves, etc.
- Refining rules and repeating the backtest: A trader adjusts the rules and retests until a robust system is found.
The process is highly repeatable, meaning you can test multiple markets and variations quickly.
How to Convert Strategy Rules Into Code
In order to automatically backtest your strategies or trading ideas, you will need to learn how to convert them into code that backtesting software can understand. Here are your options:
- Hire a programmer.
- Write the code yourself.
- Create the code with the help of artificial intelligence (such as ChatGPT or Google Gemini).
- Create the code with the help of a strategy builder.
Let’s explore which one will be right for you.
Hiring a Programmer
If you don’t know how to code, hiring a programmer is the logical choice. However, keep in mind that if you go down this route, it won’t be cheap. Programmers are among the highest-paid workers, so you’ll have to pay them accordingly.
Given this fact, it is essential to carefully consider the assignment for the programmer, as any subsequent changes will naturally lead to an increase in the final price.
The code itself should be designed in such a way that allows you to make changes to input parameters without needing a programmer.
For example, check out this script, which was created for automated backtesting in the TradeStation platform.
					{===========================================================================
 Breakout Strategy with ATR-based breakout level
 - Inputs let the user change ATR length & multiplier, lookback, offsets,
   stop loss, profit target, trailing parameters and number of contracts.
 - Long entry: stop buy above highest-high of lookback (optionally + ATR*mult)
 - Short entry: stop sell short below lowest-low of lookback (optionally - ATR*mult)
 - Exits: fixed stop-loss, profit-target, and an optional trailing stop after
   the price moves a configurable amount in favor of the trade.
===========================================================================}

Inputs:
    ATRLength(14),                 // ATR length (bars)
    ATRMultiplier(1.5),            // ATR multiplier used when UseATRBreakout = true
    BreakoutLookback(20),          // Lookback period for breakout high/low
    UseATRBreakout(true),          // If true, breakout level = hi/lo +/- ATRMultiplier * ATR
    BreakoutOffsetPoints(0.0),     // If UseATRBreakout = false, additional offset in price units
    StopLossPoints(1.0),           // Stop loss in price units (points)
    ProfitTargetPoints(2.0),       // Profit target in price units (points)
    TrailingStartPoints(1.0),      // Start trailing only after price moves this far in points
    TrailingAmountPoints(1.0),     // Distance for trailing stop (points)
    NumContracts(1),               // Number of contracts to trade
    AllowLong(true),               // Enable long trades
    AllowShort(true);              // Enable short trades

Vars:
    atrVal(0),
    hiLook(0),
    loLook(0),
    breakoutLongLevel(0),
    breakoutShortLevel(0),
    longOrderPlaced(false),
    shortOrderPlaced(false),
    inLong(false),
    inShort(false),
    highestSinceEntry(0),
    lowestSinceEntry(0),
    longTrailStop(0),
    shortTrailStop(0),
    entryPriceLong(0),
    entryPriceShort(0);

// Calculate ATR and lookback highs/lows
atrVal = AvgTrueRange(ATRLength);

hiLook = Highest(High, BreakoutLookback);
loLook = Lowest(Low, BreakoutLookback);

// Decide breakout levels
if UseATRBreakout then begin
    breakoutLongLevel  = hiLook + ATRMultiplier * atrVal;
    breakoutShortLevel = loLook - ATRMultiplier * atrVal;
end else begin
    breakoutLongLevel  = hiLook + BreakoutOffsetPoints;
    breakoutShortLevel = loLook - BreakoutOffsetPoints;
end;

// Reset tracking flags if flat
if MarketPosition = 0 then begin
    longOrderPlaced  = false;
    shortOrderPlaced = false;
    inLong  = false;
    inShort = false;
    highestSinceEntry = 0;
    lowestSinceEntry  = 0;
end;

// ENTRY LOGIC
// Place breakout stop orders (one-bar delayed stop-at-price next bar)
if MarketPosition = 0 then begin
    // Long breakout entry
    if AllowLong and Close < breakoutLongLevel then begin
        // place a stop buy at breakout level
        Buy ("LongBreak") NumContracts contracts next bar at breakoutLongLevel stop;
        longOrderPlaced = true;
    end;

    // Short breakout entry
    if AllowShort and Close > breakoutShortLevel then begin
        SellShort ("ShortBreak") NumContracts contracts next bar at breakoutShortLevel stop;
        shortOrderPlaced = true;
    end;
end;

// POST-ENTRY: set per-trade exits and manage trailing stops
// Use AvgEntryPrice to compute exit prices after entry
if MarketPosition > 0 then begin
    inLong = true;
    inShort = false;

    // Initialize highestSinceEntry on the bar of entry
    if BarsSinceEntry = 0 then begin
        highestSinceEntry = High;
        entryPriceLong = AvgEntryPrice;
    end else begin
        highestSinceEntry = MaxList(highestSinceEntry, High);
    end;

    // Fixed stop and profit target prices (next-bar exit orders)
    // Stop Loss
    ExitLong("LongStop") next bar at entryPriceLong - StopLossPoints stop;
    // Profit Target
    ExitLong("LongPT") next bar at entryPriceLong + ProfitTargetPoints limit;

    // Trailing stop: only enable after price has moved TrailingStartPoints in favor
    if (highestSinceEntry - entryPriceLong) >= TrailingStartPoints then begin
        longTrailStop = highestSinceEntry - TrailingAmountPoints;
        // Only place trailing stop if it's above the fixed stop (i.e., improving)
        ExitLong("LongTrail") next bar at longTrailStop stop;
    end;
end
else if MarketPosition < 0 then begin
    inShort = true;
    inLong = false;

    // Initialize lowestSinceEntry on the bar of entry
    if BarsSinceEntry = 0 then begin
        lowestSinceEntry = Low;
        entryPriceShort = AvgEntryPrice;
    end else begin
        lowestSinceEntry = MinList(lowestSinceEntry, Low);
    end;

    // Fixed stop and profit target for short
    ExitShort("ShortStop") next bar at entryPriceShort + StopLossPoints stop;
    ExitShort("ShortPT")   next bar at entryPriceShort - ProfitTargetPoints limit;

    // Trailing stop for short: enable after price moves TrailingStartPoints in favor
    if (entryPriceShort - lowestSinceEntry) >= TrailingStartPoints then begin
        shortTrailStop = lowestSinceEntry + TrailingAmountPoints;
        ExitShort("ShortTrail") next bar at shortTrailStop stop;
    end;
end;

// Optional housekeeping prints for debugging (comment out to declutter)
//Print("ATR: ", NumToStr(atrVal, 4), " BrkH: ", NumToStr(breakoutLongLevel, 4), " BrkL: ", NumToStr(breakoutShortLevel, 4));

{ End of strategy }
As you can see, in the Inputs section, the user can modify up to twelve strategy parameters themselves. This means they don’t have to bother the programmer with every change, which saves not only money but also valuable time.
Therefore, always try to write the assignment in such a way that the resulting script gives you the greatest possible freedom for subsequent strategy adjustments. In other words, think about all the elements of your strategy that can be modified and define the input parameters accordingly.
Where to look for programmers
Finding a good programmer is not usually difficult, especially if you want to create code for a popular trading platform such as MetaTrader, TradeStation, or NinjaTrader. Here is a list of places to start:
- MQL5 – A community of programmers focused on the MetaTrader trading platform.
- Pine Script Freelancers – The official TradingView freelancers page.
- NinjaTrader Ecosystem – A list of programming services for the NinjaTrader platform.
- Sierra Chart Study and System Programmers – A list of developers working with the Sierra Chart platform.
- r/algotrading – Reddit community of people involved in automated trading.
- Fiverr – A large number of programmers with varying levels of experience. You can find coders for the most popular programming languages and trading platforms here.
- Guru – High-quality programmers.
- Freelancer – The world’s largest marketplace for freelancers. It’s easy to find programmers for virtually any job.
- UpWork – A good place to look for reliable programmers with experience.
In the unlikely event that your search for a programmer fails and you can’t find anyone suitable, you can always use Google. Here are a few search terms you can use:
- [Your trading platform] programmer(s): for example, NinjaTrader programmers.
- [Your trading platform] developer(s): for example, TradeStation developer.
- [Platform programming language] programmer(s): for example, Pine Script programmers.
- [Platform programming language] developer(s): for example, MQL5 developers.
And if even Google doesn’t offer anything interesting, try asking on a trading forum such as BabyPips, Forex Factory, Trade2Win, or Elite Trader. There you will usually find plenty of users who will be happy to advise you.
Writing Code
The second method of converting your strategy rules into code requires programming knowledge. If you already have some experience in coding or are even a developer, you have a huge advantage.
Most trading platforms with automated backtesting capabilities use their own programming language. However, this is often based on one of the popular programming languages, such as C++ or C#. For this reason, adaptation should not take long, and after a few hours, you should be able to come up with your first strategy.
Here is a brief overview of the most popular trading platforms offering automated backtesting:
- Sierra Chart: ACSIL (based on C++)
- TradeStation: EasyLanguage (based on Pascal)
- MultiCharts: PowerLanguage, C#, Visual Basic .NET, Python
- MetaTrader: MetaQuotes Language 5 (based on C++)
- TradingView: Pine Script
- NinjaTrader: NinjaScript (based on C#)
- AmiBroker: AmiBroker Formula Language
In recent years, backtesting using the Python programming language has also been on the rise. In this case, strategies are not tested in the trading platform, but with an editor and several necessary libraries.
Unfortunately, backtesting with Python is a very broad topic and far beyond the scope of this guide. However, if you want to go down this route, here are a few tips on tools that might come in handy:
Historical data
Backtesting frameworks
- Backtrader – popular, flexible, supports live trading.
- Zipline – institutional style, but harder to set up.
- Vectorbt – vectorized, very fast.
- Bt – portfolio-oriented backtesting.
- Lumibot – backtesting and trading library.
- Backtesting.py – a simple, clear framework for beginners.
Performance & analysis
- Pyfolio – tear sheets with risk metrics.
- Matplotlib – a comprehensive library for creating static, animated, and interactive visualizations.
- Plotly – visualization.
- Seaborn – a Python data visualization library based on matplotlib.
- Pandas – a fast, powerful, flexible, and easy-to-use open source data analysis and manipulation tool.
If you are interested in what Python code for a simple moving average crossover strategy looks like, here is an example.
					import pandas as pd
import matplotlib.pyplot as plt

# Load some example data (you can replace this with your own CSV)
# Let's assume the data has columns: Date, Open, High, Low, Close
data = pd.read_csv('AAPL.csv', parse_dates=['Date'], index_col='Date')

# Create short and long moving averages
data['SMA_short'] = data['Close'].rolling(window=20).mean()  # 20-day MA
data['SMA_long'] = data['Close'].rolling(window=50).mean()   # 50-day MA

# Generate trading signals
data['Signal'] = 0
data.loc[data['SMA_short'] > data['SMA_long'], 'Signal'] = 1   # Buy signal
data.loc[data['SMA_short'] < data['SMA_long'], 'Signal'] = -1  # Sell signal

# Plot the results
plt.figure(figsize=(12,6))
plt.plot(data['Close'], label='Close Price', alpha=0.5)
plt.plot(data['SMA_short'], label='20-day SMA', linestyle='--')
plt.plot(data['SMA_long'], label='50-day SMA', linestyle='--')

# Mark Buy/Sell signals
plt.plot(data[data['Signal'] == 1].index, data['Close'][data['Signal'] == 1],
         '^', markersize=10, color='g', label='Buy Signal')
plt.plot(data[data['Signal'] == -1].index, data['Close'][data['Signal'] == -1],
         'v', markersize=10, color='r', label='Sell Signal')

plt.title('Simple Moving Average Crossover Strategy')
plt.legend()
plt.show()
Pretty straightforward, don’t you think? Even someone without programming knowledge can understand the script above. That’s the power of Python—simplicity and clarity.
Compared to the other methods of code creation, writing code has one major advantage. You can backtest virtually anything and in any way. All you need is a sufficiently large sample of historical data and a powerful backtesting engine that won’t limit you.
Creating Code With the Help of Artificial Intelligence
We live in truly incredible times. Just a few years ago, most of us couldn’t even imagine that writing a few lines into something called an AI chatbot would be enough to create the code for a trading strategy. Today, this is a reality.
Thanks to AI, we can create scripts, indicators, or strategies in a matter of seconds, without needing any knowledge of programming languages.
But don’t get it wrong. It always pays to learn the programming language you’re going to use to create your strategies. Even AI isn’t perfect enough yet to avoid making mistakes. That’s why understanding the code, at least in part, is worthwhile for detecting and correcting any errors.
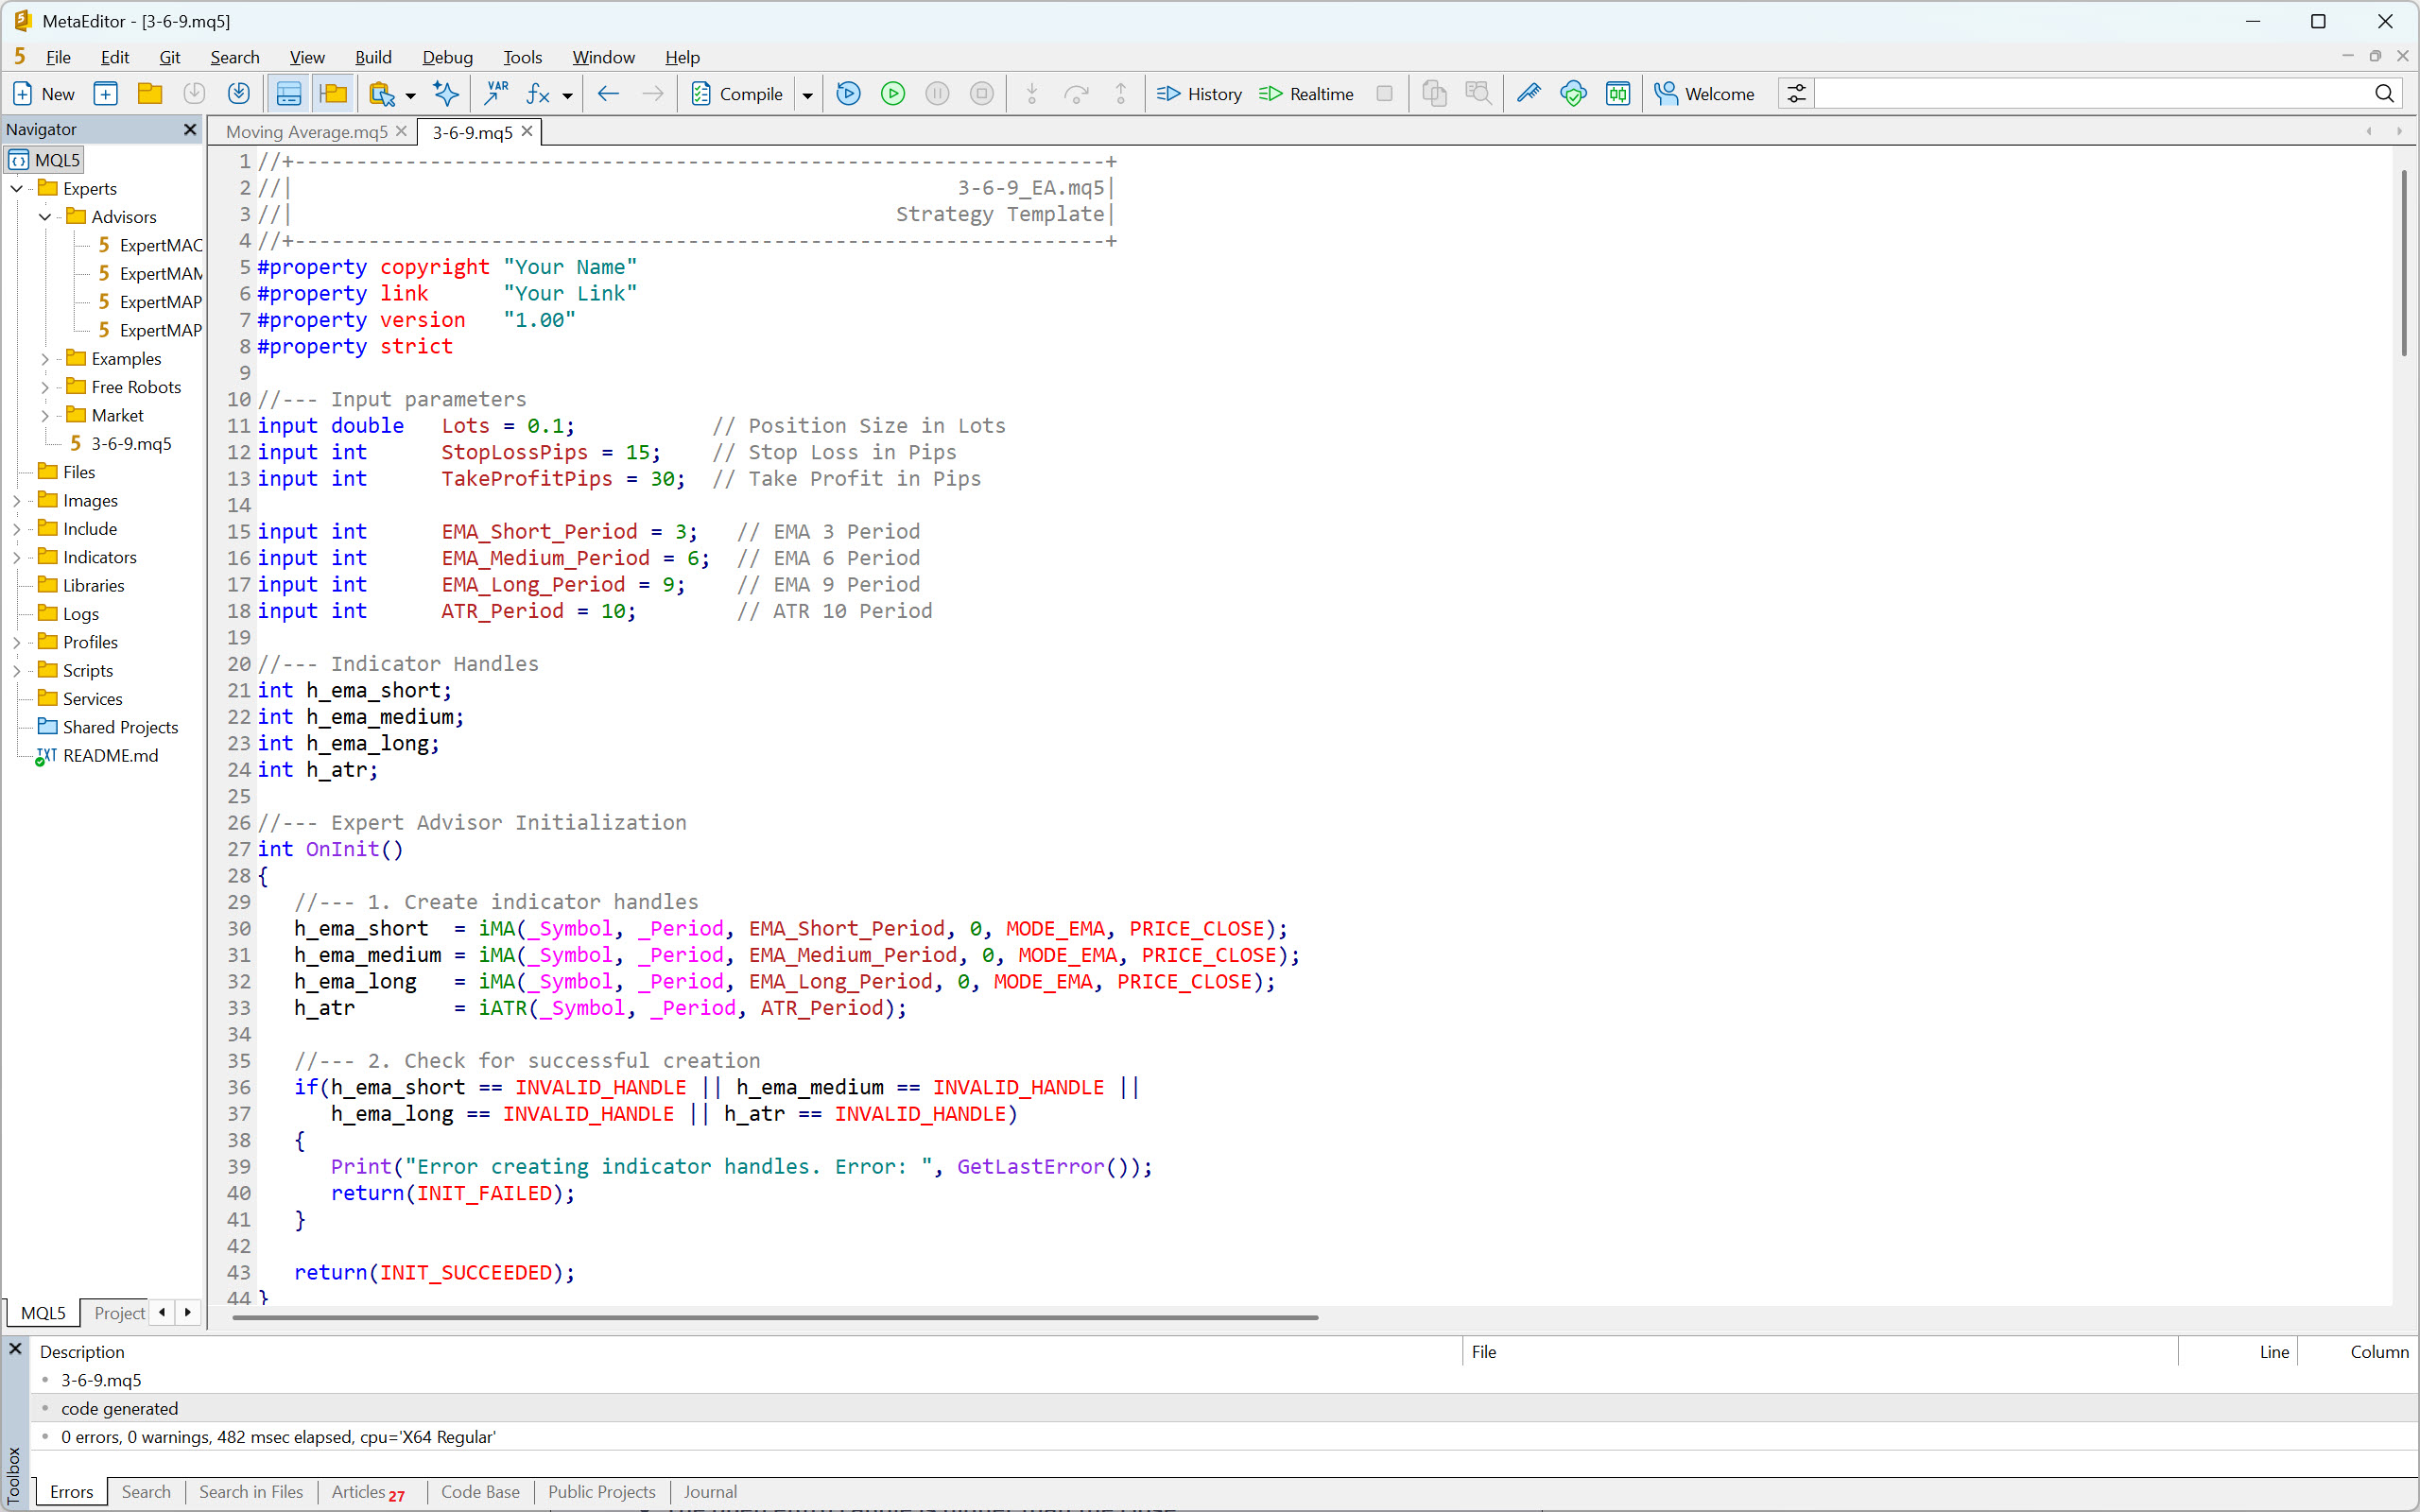
As an example of how easy it is to generate code for a strategy backtest in the Metatrader platform, we will use ChatGPT.
The prompt for creating the strategy code might look like this:
I use MetaTrader 5. I want you to create code for my strategy, called 3-6-9.
Rules for entering a long position
- EMA (3) is above EMA (6)
- EMA (6) is above EMA (9)
- It is between 2 a.m. and 12 p.m. New York time.
- The entry candle is greater than 2x ATR(10)
- The open of the entry candle is lower than the close
Rules for entering a short position
- EMA (3) is below EMA (6)
- EMA (6) is below EMA (9)
- It is between 2 a.m. and 12 p.m. New York time.
- The entry candle is greater than 2x ATR(10)
- The open entry candle is higher than the close
Position sizing
- If the rules for a long position are met, buy 0.1 lot.
- If the rules for a short position are met, sell 0.1 lot.
Risk management
- Use a stop loss of 15 pips.
- Use a profit target of 30 pips.
And here is your MQL5 script:
					//+------------------------------------------------------------------+
//|                                                      3-6-9_EA.mq5|
//|                                                 Strategy Template|
//+------------------------------------------------------------------+
#property copyright "Your Name"
#property link      "Your Link"
#property version   "1.00"
#property strict

//--- Input parameters
input double   Lots = 0.1;           // Position Size in Lots
input int      StopLossPips = 15;    // Stop Loss in Pips
input int      TakeProfitPips = 30;  // Take Profit in Pips

input int      EMA_Short_Period = 3;   // EMA 3 Period
input int      EMA_Medium_Period = 6;  // EMA 6 Period
input int      EMA_Long_Period = 9;    // EMA 9 Period
input int      ATR_Period = 10;        // ATR 10 Period

//--- Indicator Handles
int h_ema_short;
int h_ema_medium;
int h_ema_long;
int h_atr;

//--- Expert Advisor Initialization
int OnInit()
{
   //--- 1. Create indicator handles
   h_ema_short  = iMA(_Symbol, _Period, EMA_Short_Period, 0, MODE_EMA, PRICE_CLOSE);
   h_ema_medium = iMA(_Symbol, _Period, EMA_Medium_Period, 0, MODE_EMA, PRICE_CLOSE);
   h_ema_long   = iMA(_Symbol, _Period, EMA_Long_Period, 0, MODE_EMA, PRICE_CLOSE);
   h_atr        = iATR(_Symbol, _Period, ATR_Period);

   //--- 2. Check for successful creation
   if(h_ema_short == INVALID_HANDLE || h_ema_medium == INVALID_HANDLE ||
      h_ema_long == INVALID_HANDLE || h_atr == INVALID_HANDLE)
   {
      Print("Error creating indicator handles. Error: ", GetLastError());
      return(INIT_FAILED);
   }

   return(INIT_SUCCEEDED);
}

//--- Expert Advisor Deinitialization
void OnDeinit(const int reason)
{
   //--- Release indicator handles
   IndicatorRelease(h_ema_short);
   IndicatorRelease(h_ema_medium);
   IndicatorRelease(h_ema_long);
   IndicatorRelease(h_atr);
}

//--- Expert Advisor Tick Function
void OnTick()
{
   // Check if the EA is waiting for the close of a new bar
   if (!IsNewBar()) return;

   // Check if a position is already open for this symbol
   if (PositionSelect(_Symbol)) return;

   //--- Variable Declarations
   double ema_short[2], ema_medium[2], ema_long[2]; // [0] current, [1] previous
   double atr_value[1]; // [0] current
   MqlRates rates[2];    // [0] current/entry bar, [1] previous bar

   //--- 1. Get Indicator Data for the **Entry Bar (shift 1)**
   // We are checking the entry condition on the *closed* bar (shift 1)
   // and will open on the *open* of the *next* bar (shift 0).
   if(CopyBuffer(h_ema_short, 0, 1, 2, ema_short) != 2 ||
      CopyBuffer(h_ema_medium, 0, 1, 2, ema_medium) != 2 ||
      CopyBuffer(h_ema_long, 0, 1, 2, ema_long) != 2 ||
      CopyBuffer(h_atr, 0, 1, 1, atr_value) != 1)
   {
      Print("Error copying indicator data. Error: ", GetLastError());
      return;
   }

   //--- 2. Get Price Data for the **Entry Bar (shift 1)**
   if(CopyRates(_Symbol, _Period, 1, 2, rates) != 2)
   {
      Print("Error copying price data. Error: ", GetLastError());
      return;
   }

   //--- 3. Check Trading Hours (Needs Time Zone Logic)
   if (!IsTradingTime()) return;

   //--- 4. Calculate ATR-based Stop Size
   double atr_2x = 2.0 * atr_value[0];
   double entry_candle_size = MathAbs(rates[0].open - rates[0].close);

   //--- 5. Long Entry Conditions
   bool long_ema_ok = (ema_short[0] > ema_medium[0] && ema_medium[0] > ema_long[0]);
   bool long_candle_size_ok = (entry_candle_size > atr_2x);
   bool long_candle_type_ok = (rates[0].open < rates[0].close); // Bullish Candle

   if (long_ema_ok && long_candle_size_ok && long_candle_type_ok)
   {
      double sl_price = rates[1].open - StopLossPips * _Point; // Use Open of the NEXT bar (rates[1]) for the order price
      double tp_price = rates[1].open + TakeProfitPips * _Point;

      // Normalize Stop Loss and Take Profit prices
      sl_price = NormalizeDouble(sl_price, _Digits);
      tp_price = NormalizeDouble(tp_price, _Digits);

      //*** EXECUTION: You need to implement your trade execution (Buy Lots at Market) ***
      // Example of a function you would use (or similar class methods):
      // Trade.Buy(Lots, _Symbol, rates[1].open, sl_price, tp_price);
      Print("Long Signal: EMA, ATR, and Candle Type conditions met.");
   }

   //--- 6. Short Entry Conditions
   bool short_ema_ok = (ema_short[0] < ema_medium[0] && ema_medium[0] < ema_long[0]);
   bool short_candle_size_ok = (entry_candle_size > atr_2x);
   bool short_candle_type_ok = (rates[0].open > rates[0].close); // Bearish Candle

   if (short_ema_ok && short_candle_size_ok && short_candle_type_ok)
   {
      double sl_price = rates[1].open + StopLossPips * _Point;
      double tp_price = rates[1].open - TakeProfitPips * _Point;

      sl_price = NormalizeDouble(sl_price, _Digits);
      tp_price = NormalizeDouble(tp_price, _Digits);

      //*** EXECUTION: You need to implement your trade execution (Sell Lots at Market) ***
      // Example of a function you would use (or similar class methods):
      // Trade.Sell(Lots, _Symbol, rates[1].open, sl_price, tp_price);
      Print("Short Signal: EMA, ATR, and Candle Type conditions met.");
   }
}

//+------------------------------------------------------------------+
//| Helper Function: Check for New Bar                               |
//+------------------------------------------------------------------+
bool IsNewBar()
{
   static datetime last_time = 0;
   datetime current_time[1];

   if (CopyTime(_Symbol, _Period, 0, 1, current_time) > 0)
   {
      if (last_time != current_time[0])
      {
         last_time = current_time[0];
         return true;
      }
   }
   return false;
}

//+------------------------------------------------------------------+
//| Helper Function: Check Trading Time (2 a.m. to 12 p.m. NY Time)  |
//| IMPORTANT: This is the most complex part due to DST.             |
//| A more robust function is required for production use.           |
//+------------------------------------------------------------------+
bool IsTradingTime()
{
    // A simplified approach: Get GMT time, convert to NY, and check the hour.
    // NOTE: This simple method may be wrong during DST transition periods.
    // NY is UTC-5 (EST) or UTC-4 (EDT).

    MqlDateTime gmtTime;
    TimeToStruct(TimeGMT(), gmtTime);

    // Get the broker's server time zone offset in seconds from GMT
    long gmt_offset_sec = (long)TimeGMT() - (long)TimeCurrent();

    // Check for Daylight Saving Time (DST) on the broker's server
    // A common, though not universally accurate, method to check DST:
    // If broker time is GMT+2 in winter and GMT+3 in summer, and
    // the TimeServer() hour is different from the TimeGMT() hour + offset, DST is active.

    // For a *rough* estimation, we'll use a fixed offset (e.g., -5 hours)
    // and adjust manually for DST if necessary (e.g., -4 hours).

    // A function from a library (like the one in the search results)
    // or a more complex calculation that checks the date is the *correct* way.

    // Example of a *basic* (and potentially incorrect during DST changes) calculation:
    int NY_Offset_Hours = -5; // Default EST (UTC-5)

    // *** You need to determine if NY is currently in EDT (UTC-4) or EST (UTC-5)
    // and set NY_Offset_Hours accordingly based on the current date. ***

    int NY_Hour = gmtTime.hour + NY_Offset_Hours;
    if (NY_Hour < 0) NY_Hour += 24; // Handle wrap-around for time before midnight
    if (NY_Hour >= 24) NY_Hour -= 24; // Handle wrap-around for time after midnight

    int start_hour = 2; // 2 a.m. NY
    int end_hour = 12; // 12 p.m. NY (noon)

    if (NY_Hour >= start_hour && NY_Hour < end_hour)
    {
        return true;
    }

    return false;
}

/*
// --- NOTES FOR IMPLEMENTATION ---

1.  **Time Zone:** The `IsTradingTime()` function is a placeholder. You *must* implement a robust system to handle **New York DST (Daylight Saving Time)** changes, as the offset from GMT/UTC changes twice a year (UTC-5 in winter, UTC-4 in summer). Search the MQL5 community for a reliable `IsNYDST()` function or a time zone library.

2.  **Trade Execution:** The EA needs a trading library (like the built-in `CTrade` class, `#include <Trade/Trade.mqh>`) to open, modify, and close positions. The `Trade.Buy()` and `Trade.Sell()` lines are placeholders. You'll need to calculate the actual stop loss and take profit *prices* based on the entry price and the pips.

3.  **Position Selection:** The check `if (PositionSelect(_Symbol)) return;` ensures the EA only opens one position at a time on the current symbol.

4.  **Entry Bar Shift:** The code uses `rates[0]` for the entry candle's OHLC and `rates[1]` for the price of the candle that is *currently* opening (where the order will be placed). This is common practice: check conditions on the *closed* bar and enter on the *open* of the next bar.

*/
Now all you have to do is paste it into the MetaEditor, compile it, and start backtesting!
Creating Code in the Strategy Builder
The last way to convert trading strategy rules into code is to use a so-called strategy builder.
As the name suggests, this is a special software that allows users to create (build) trading strategies without any knowledge of coding. In the program environment, you simply configure how you want your strategy to work, and the strategy builder then generates code that you can insert into your trading platform for subsequent backtesting.
Some builders even offer a backtesting function built right in, eliminating the need for a trading platform with backtesting capabilities. This is definitely something that can significantly speed up the entire backtesting workflow, making it a worthwhile consideration when choosing the right builder.
Here is an overview of several strategy builders that should not be overlooked:
- VizQuant – Strategy builder and backtesting engine.
- TradeFlow –
- AlgoBuilder – AI strategy builder and backtesting engine.
- ClickAlgo – cTrader strategy builder.
- Phoenix Copilot – AI strategy builder and backtesting engine.
- Octopi Trader – Sierra Chart strategy builder.
- Pineify – TradingView strategy builder.
- Pinetrader – TradingView strategy builder.
Another interesting option is strategy builders, capable of generating new strategies using machine learning.
Yes, you read that correctly. Instead of spending long hours devising new strategies, you can let the software do it for you. What’s more, it will backtest them and, if necessary, even optimize them.
Depending on the performance of your PC or server, these special strategy builders can create hundreds or even thousands of unique strategies, which can then be backtested on popular trading platforms such as Tradestation, Multicharts, or MetaTrader.
So, if you are interested in this solution, be sure to check out these two builders:
- StrategyQuant – Trading strategy generator.
- Adaptrade Builder – Trading strategy generator.
Advantages of Automated Backtesting
- Speed: Test years of data and hundreds of rules in minutes.
- Objectivity: No human bias—rules are applied exactly as written.
- Statistical power: Large sample sizes give more reliable insights.
- Scalability: You can test across multiple assets, timeframes, and conditions.
- Advanced features: Monte Carlo analysis, walk-forward testing, optimization.
Drawbacks of Automated Backtesting
- Requires skills: To fully utilize the potential of automated backtesting, you need to know how to code.
- Overfitting risk: The temptation to “tune” parameters until they fit past data perfectly (curve fitting), which usually fails in live trading.
- Rigid rules: Some discretionary or intuitive elements (like “the market feels strong here”) are impossible to code.
- Garbage in, garbage out: Bad data quality or unrealistic assumptions (no slippage, perfect fills) can produce misleading results.
- Complexity: Setting up realistic models for spreads, commissions, and execution can be tricky.
When Automated Backtesting Makes Sense
Automated backtesting is best if:
- You trade purely rule-based systems.
- You want statistically significant results.
- You’re comfortable with coding.
- You need to test multiple markets or variations at once.
- You want to refine your trading strategy quickly and objectively.
Trading Plan
Before you start any backtesting, create a trading plan. If you are serious about backtesting, there is a good chance that you will perform hundreds or even thousands of backtesting sessions over the years. However, without a well-written trading plan, you will not know what rules your strategies followed and therefore may not be able to replicate their results.
For this reason, it is necessary not only to create trading plans carefully, but also to archive them correctly along with the backtest results.
Writing a trading plan is not a complicated process. The main thing to remember is to write it in a way that assumes you are explaining your strategy to someone else. This means not leaving out any details and being as descriptive as possible.
Here is a suggested structure for a trading plan that you should follow:
- Strategy description – A concise description of the strategy.
- Time frames – A list and description of the time frames the strategy works with.
- Technical indicators – List and settings of the indicators used by the strategy.
- Markets – List of markets and description of how the strategy uses them.
- Trading time – Definition of the time periods in which the strategy is deployed.
- Entries – List of rules for entering long and short positions.
- Exits – Rules for exiting positions.
- Risk & Money Management – Determination of risk per trade (position sizing) and maximum daily or weekly drawdown.
- Trade management – Rules for moving stop losses, trading in unclear situations, or during the announcement of events.
Example of a Simple Trading Plan
1. Strategy description
The 3-6-9 intraday strategy seeks to benefit from capturing short-term momentum, using three exponential moving averages to determine the direction of trading.
2. Time frames
The strategy uses 5-minute time frame.
3. Technical indicators
- EMA with a period of 3.
- EMA with a period of 6.
- EMA with a period of 9.
4. MarketsEURUSD.
5. Trading time
Entries into positions can only take place between 2 a.m. and 10 a.m. New York time.
6. Entries
Rules for entering a long position:
- EMA (3) is above EMA (6)
- EMA (6) is above EMA (9)
- It is between 2 a.m. and 12 p.m. New York time.
- The entry candle is greater than 2x ATR(10)
- The open of the entry candle is lower than the close
Rules for entering a short position:
- EMA (3) is below EMA (6)
- EMA (6) is below EMA (9)
- It is between 2 a.m. and 12 p.m. New York time.
- The entry candle is greater than 2x ATR(10)
- The open entry candle is higher than the close
7. Exits
Exit from a position occurs when one of the following conditions is met:
- Profit target reached.
- Stop loss reached.
- 2 pm New York time has arrived (time-based stop loss).
The profit target is always three times the size of the risk, i.e., RRR 1:3.
8. Risk & Money Management
- The risk per trade is 0.1 lot.
- A maximum of three losing trades per day is allowed.
9. Trade Management
Once the price moves towards the profit target by twice the risk, the stop loss can be moved to break even.
Nothing complicated, right? With such a trading plan, you will always know how the backtest was performed.
However, keep in mind that your trading plan should be linked to the results of your backtest in some way.
For example, our Backtesting Club Trading Journal addresses this by including a Trading Plan sheet, ensuring that traders do not lose critical information about the tested strategy.
Historical Data
From the section on backtesting methods, you already know that there is such a thing as historical 1-minute and tick-by-tick data. However, the difference between them is not the only factor you should consider when choosing your backtesting solution. In fact, there are five key criteria that need to be taken into account in your decision-making process.
- Data price
- Data quality
- Data range
- Data type
- Range of markets
Let’s explore them one by one.
Data price
Not so long ago, the only way to obtain high-quality historical data was to pay a considerable amount of money for it. Fortunately, prices are much lower today, and in some cases, historical data can even be obtained completely free of charge!
The amount you pay for data depends on the backtesting solution you choose. So let’s take a look at your options.
Historical data included in the subscription to a trading platform or backtesting tool
The first way to get historical data is to subscribe to a trading platform or backtesting tool. Some backtesting software developers have correctly understood that their customers do not want to deal with searching for historical data. Therefore, instead of offering only software, they have also become data providers or resellers, offering customers an all-in-one solution.
The price usually ranges from $25 to $100.
This category includes, for example, Sierra Chart, FX Replay, Forex Tester, and TradeZella.
Historical data for a fee or subscription
The second option is to purchase or subscribe to the data. Each historical data provider has its own pricing structure, so you will have to compare the offers yourself to find the one that suits you best. In general, however, obtaining historical data in this way is the most expensive option.
Here is a brief overview of historical data providers worth considering:
- Tickdatamarket – Historical tick-by-tick data for NinjaTrader and Metatrader.
- Tickstory – Historical tick-by-tick data for NinjaTrader, Metatrader, Amibroker, and other platforms.
- Portara Ninja – Historical tick-by-tick data for NinjaTrader.
- Tick Data LLC – Historical tick-by-tick data with a choice of custom formats.
- Massive – Historical data for backtesting with Python.
- Databento – Historical data for backtesting with Python and C++.
- EODHD – Historical tick-by-tick and fundamental data.
- Barchart – Historical tick-by-tick and fundamental data.
Free historical data after opening a live trading account
The brokerage industry is a highly competitive environment, which is great for us as customers. In recent years, the capital requirements for opening a live trading account have been significantly reduced, allowing virtually anyone to obtain one today.
If you do a little research on brokers, you will find that most of them do not even require a deposit to open a live account! That’s absolutely crazy, don’t you think? However, sometimes a positive account balance is required in order to provide live and historical data. Therefore, funding your live account with a few dollars may be necessary after all.
In any case, opening a live trading account is a great way to access historical data. If you are interested in this option, be sure to check out our overview of backtesting software, where you will find several tips on brokers that make historical data available to their customers in this way.
Free historical data
When you download any free trading platform, you usually get access to sample historical data. This usually consists of a few months of 1-minute or tick data and a couple of years of daily data.
This is not bad for getting acquainted with the trading platform, but it will certainly not be enough for serious backtesting.
Fortunately, there are a few options for accessing historical data for free, allowing you to expand the backtesting capabilities of your platforms.
The following are particularly noteworthy:
Data Quality
The results of your backtested strategy will only correspond to reality if you work with accurate and reliable historical data. This statement is especially true for historical tick-ba-tick data, where we really need it to capture the past exactly as it happened.
You definitely don’t want to use incomplete data that has gaps or incorrectly sorted values. Therefore, always try to find as much information as possible about your potential historical data provider to avoid such problems.
Trading forums such as BabyPips, ForexFactory, Trade2win, and EliteTrader are usually good sources of data provider reviews. And if you can’t find any, you can always start a new thread to ask a question. There are always experienced traders who are happy to offer their advice.
You can also compare live and historical data yourself, as shown in the video below. Simply create a screen recording while the market is active and then compare it with the replayed data. Such a test will definitely give you a clear answer about the historical data quality you are working with.
Data Range
The more historical data, the better. It’s that simple.
When backtesting a strategy, you want to know what results it can deliver in different periods. However, you need sufficient data for this purpose. Therefore, always check with your data provider to find out how deep their historical data goes.
Data Type
Historical data providers and brokers typically offer three types of data:
- Daily historical data, also known as End Of Day data (EOD).
- 1-minute historical data.
- Tick-by-tick historical data.
The logic of your strategy determines what data you will need for your backtest. For example, if your strategy works with a 15-second chart, you will need to obtain tick-by-tick historical data, as this is what is used to construct each 15-second candle or bar.
On the other hand, if the entry and exit conditions occur on a 15-minute or hourly chart, 1-minute historical data is usually sufficient.
The main point is to research what data you need to construct your charts and indicators, and then look for their source accordingly.
Here is a short overview of the recommended types of historical data according to trading style:
- Position trading – Daily data.
- Swing trading – 1-minute data.
- Intraday trading – 1-minute or tick-by-tick data.
- Scalping – Tick-by-tick data.
Note: While daily and 1-minute data are widely available, not every broker or data provider offers tick-by-tick data. Keep that in mind when conducting your research.
Range of Markets
When you are preparing to backtest a trading strategy, you usually already know which specific markets you need historical data for.
For example, if you have a strategy focused on stock indices, you will probably be looking for a solution that allows you to backtest the NQ, ES, or YM futures markets.
There are several providers of historical futures data on the market, so this would certainly not be a problem. But what if you decide to find out whether your strategy also works for individual stocks? Wouldn’t it be nice if your data provider offered stock data in addition to historical futures data at no extra cost? Of course it would!
A historical data provider with a wide range of markets and asset classes will not only save you a lot of money, but also make the entire backtesting process easier.
Backtesting Spreadsheet
When you decide to perform manual backtesting as a professional trader, you will need a sophisticated backtesting spreadsheet. This is true even if your backtesting solution supports automatic data recording.
A proper backtesting spreadsheet typically consists of two parts:
- Data sheet: to collect data.
- Analytical sheet: to convert the gathered data into metrics and charts.
Let’s examine what they should look like and what they should include.
Data Sheet
When it comes to recording trades, your data sheet must include the following columns:
- Trade ID (number)
- Trade entry date
- Trade entry time
- Market
- Trade direction
- Entry price
- Stop loss price
- Exit price
- Trade exit date
- Trade exit time
- Trade result (profit or loss)
The above information is the absolute minimum that you should record in your data sheet. This is sufficient for calculating basic metrics, such as profit factor, win rate, average trade, and drawdown, etc. However, most professional traders would definitely not be satisfied with such a small sample of data.
When a professional trader performs a backtest, they try to extract as much data as possible to gain a deep understanding of their strategy. Thanks to the additional information, they can then perform various optimizations of the strategy parameters, which often lead to increased profitability and reduced drawdowns. The extra work is thus very well rewarded.
So what else should you collect? Well, the possibilities are truly endless. As a general rule, you should focus on any data that can later be used as filters. However, it is also useful to collect anything that can help to observe new facts about the backtested strategy, such as screenshots.
Here are some ideas of what you can include in your data sheet:
- Setup – If the strategy uses multiple setups.
- Setup quality – A, B, C.
- Setup variables – Conditions that are not included in the setup rules, but you want to monitor.
- Market context – Uptrend, downtrend, or range-bound market.
- Entry timeframe – The timeframe in which the setup took place. For example, 1m, 5m, 15m, etc.
- Position size – The size of the position. For example, five contracts, two lots, etc.
- Exchange rate – If you are backtesting markets denominated in different currencies, and need to convert exchange rates.
- Trade group – Unique identifier for basket and hedge trades.
- MAE – Maximum Favorable Excursion.
- MFE – Maximum Adverse Excursion
- Chart before entry – Link to a screenshot of the chart as it looked before entering the trade.
- Chart after exit – Link to a screenshot of the chart as it looked after exiting the trade.
- Note – Anything that comes to mind, catches your attention, and is relevant.
There is a lot to record, and it is up to you to decide what is important. Therefore, before you start backtesting, take some time to think about what data you want the backtest to provide and choose the columns accordingly.
A well-designed data sheet will also help you calculate certain data itself, thereby simplifying and speeding up the entire process. For example, it can automatically calculate position size, profit and loss, current equity size, risk per trade as a percentage, and much more.
Analytical Sheet
Once you have logged a sufficient number of trades into the data sheet, it is time to convert the collected information into metrics and attractive graphs. This is precisely what the analytical part of the backtesting spreadsheet is for.
In terms of metrics, the analytical sheet should be able to calculate at least the following:
- Total profit/loss
- Average trade – Also known as trade expectancy.
- Average winning trade
- Average losing trade
- Number of winning trades
- Number of losing trades
- Total number of trades
- Win rate
- Maximum drawdown
- Profit factor
- Payoff ratio
These metrics are sufficient for a basic assessment of a trading strategy. However, to gain a truly deep understanding of how it works, you will need a more detailed overview.
For inspiration, check out the Backtesting Club Trading Journal, which provides traders with all the critical information about their strategy.
It is also desirable for the analytical part to visually present the collected data. Therefore, charts such as cumulative profit and loss (equity chart), profit and loss by trade, drawdown over time, and the like should not be missing.
Again, a great example is the Backtesting Club Trading Journal, which features numerous charts organized by various criteria.
Manual vs. Automatic Recording of Backtesting Data
Most trading platforms and backtesting tools with chart replay functionality can record executed trades automatically. So why should you even bother with a backtesting spreadsheet? Well, here are four reasons to consider.
Preserving collected data
If you use an online backtesting tool, you can never be sure how long your backtest results will be stored on the server. Although the operators of these tools claim that the data retention is unlimited (usually for their highest subscription plans), the truth is that you have zero control over it. If the company goes out of business or experiences problems with its servers, the data is simply gone.
With traditional trading platforms, the story is similar. They are also often able to store the results of the backtesting sessions. However, even in this case, data loss can occur.
For example, data can be accidentally overwritten by the user, the hard drive can be damaged, or a virus can infect the computer. Unfortunately, such situations do occur, and you should definitely keep this in mind.
In contrast, a backtesting spreadsheet can be backed up in multiple locations, which virtually eliminates the risk of data loss.
Data protection
If you are one of those people obsessed with cybersecurity, you probably won’t want to use any of the online backtesting tools. The truth is that we don’t really know how our data is handled in this scenario.
It is reasonable to assume that the creators of these tools have full control over the data flowing through their servers. In a purely hypothetical case, if they wanted to, they could reverse engineer their users’ best strategies.
No one is saying that they do this!
But it is a real possibility, and you should be aware of it.
As opposed to this, the data stored in a backtesting spreadsheet is only available to you, and only you decide with whom you might share it.
Specific data collection
Every trading platform or backtesting tool with a chart replay function automatically records the following nine pieces of data:
- Trade entry date
- Trade entry time
- Entry price
- Trade direction
- Trade exit date
- Trade exit time
- Exit price
- Market
- Position size
That’s it. Everything else is either calculated or added manually by the user, if such an option exists.
However, from the previous paragraphs, you already know that an experienced trader always wants to collect more data. They would certainly not be satisfied with recording only nine pieces of data, even if done automatically.
A backtesting spreadsheet provides traders the freedom to record any specific data with the option of subsequent in-depth analysis. This is something that is not possible with trading platforms and backtesting tools due to their limitations.
Automatic recording of executed trades is a nice feature that speeds up the backtesting process. However, the price for this is poor data collection. Therefore, consider whether it would not be better to record the data manually and obtain additional specific data that you would normally lose with automatic recording.
Deeper data analysis
When you start evaluating the collected data through your trading platform or backtesting tool, you are usually limited to the analysis tools that developers have created for this purpose.
However, if your backtesting solution allows you to export data, you can utilize third-party software, such as Market System Analyzer or QuantAnalyzer, to expand your analysis. For a few hundred dollars, you can get a really good analytical tool that will automatically process your data into clear reports and provide additional information about your strategy.
It probably won’t surprise you, but a sophisticated backtesting spreadsheet can also handle deep data analysis. Additionally, it enables you to analyze specific data that cannot be imported into these programs.
Compared to other solutions, a backtesting spreadsheet provides you virtually unlimited possibilities for what you can do with the collected data.
For example, you can examine the dependencies of different variables, filter data according to specific criteria, compare different strategies, and so on. As they say, the sky’s the limit.
The Pitfalls of Backtesting
Backtesting is a powerful activity that turns amateurs into market experts. However, if done incorrectly, it can produce misleading results. To avoid this, be aware of the following pitfalls of backtesting.
Overfitting
Overfitting, also known as curve fitting, is a situation where a trader tweaks the rules of their strategy until it perfectly fits historical data, but then fails once it is deployed in real-world conditions. In other words, the strategy does not deliver the results in the future that the promising backtest showed.
Overfitting typically occurs in complex strategies that utilize multiple parameters, such as a combination of several different indicators with various time periods. In contrast, simple strategies that work with basic elements, such as price action levels, tend to be much more resistant to overfitting.
Therefore, look for (or develop) strategies that use robust logic with a minimum number of parameters.
However, to truly reduce the risk of strategy overfitting, you need to include some form of robustness testing in your analytical workflow, such as dividing historical data into in-sample and out-of-sample parts.
For example, if you have five years of historical data available, you can divide it as follows:
- In-sample historical data – First four years (80% of data)
- Out-of-sample historical data – Last year (20% of data)
You will use the first four years of data to develop your strategy. This means that you will repeatedly backtest and adjust its rules and parameters until you are satisfied with the results.
Once you have the final strategy, you will backtest it using the last year of data (out-of-sample data) to see if it delivers similar results to those on the in-sample data. If it does, it is likely a robust strategy, and you can consider trading it in live markets.
Look-ahead Bias
Look-ahead bias occurs when a strategy is applied using information that was not available at the time of the trading decision. This means that it uses future data for historical analysis, which typically leads to overly optimistic results.
Here are some examples of look-ahead bias:
- You backtest on data that you know very well, and therefore, you may subconsciously filter out certain trades.
- You use an indicator, such as a moving average, that works with data from subsequent time periods (days, hours, minutes, seconds).
- Your strategy uses a rule that buys when the next day’s close is higher than today’s open. But when you test it, you accidentally use the next day’s close (future information) to decide today’s trade.
- You test a strategy that buys stocks with a P/E ratio below 10. However, your dataset uses the final, revised earnings for the quarter, which were published weeks after the initial release.
As you can see, look-ahead bias can arise quite easily. Therefore, whenever the results of your strategy seem too good to be true, you should investigate whether this phenomenon has occurred.
Survivorship Bias
If you plan to backtest stock portfolios, you should be aware of survivorship bias.
Survivorship bias, also known as survivor bias, refers to the tendency to view the performance of existing stocks as a representative and comprehensive sample, without considering those that have gone bust. This perception naturally leads to an overestimation of stock portfolio results because it ignores market reality.
For example, suppose you backtest a stock strategy using only today’s companies from the S&P 500 index, ignoring companies that were in the index years ago but have since gone bankrupt. In that case, the results will appear better than they actually should.
To avoid this, use historical index constituents or broad datasets that include delisted instruments.
Ignoring Costs
The size of spreads, commissions, fees, and swaps can significantly distort backtest results, especially in the case of scalping strategies.
If you do not take these costs into account when backtesting, you are not simulating real trading conditions. The results of your strategy’s backtest must always be “adjusted” for costs, as this is the only way to get a true picture of its profitability. A good backtesting spreadsheet can help you with this.
Frequently Asked Questions
Is it also possible to backtest option strategies?
Yes, it is certainly possible to backtest option strategies.
However, you will need special software such as AlgoTest, Orats, or OptionNet Explorer.
How many trades should I record for the backtest results to be statistically significant?
It is commonly stated that statistical significance begins at 30 trades. However, no professional trader would be satisfied with such a small sample of data.
The minimum you should aim for is 100 trades per backtest. Why specifically 100 trades? Because only this amount of data is sufficient to provide a reliable picture of the performance of the backtested strategy.
Moreover, if these trades were taken under different market conditions, you can be almost certain that for a given sample, the statistical significance is very high.
Conclusion
You did it! By reaching the end of this comprehensive guide to backtesting, you have proven that you take your trading seriously.
Now you know exactly how to backtest a trading strategy and what you need to do it. You understand the advantages and disadvantages of automated and manual trading, and you have a decent overview of the various backtesting methods. All that’s remaining is to decide which direction you want to go in and get started.
Remember that although backtesting is a powerful and very useful weapon in a trader’s arsenal, it does not work like a crystal ball. Past performance of strategies does not guarantee future results. However, thanks to backtesting, you significantly increase your chances of succeeding in the markets.
Professional traders are well aware of this fact, which is why they end most days on the winning side. So learn from them and kick off your first backtesting session!