How to Backtest a Trading Strategy on TradingView

Table of Contents

TradingView is one of the fastest-evolving trading platforms in the world, leaving many of its competitors struggling to keep up. Hardly a week goes by without new features or improvements being rolled out. Recently, tools for manual and automated backtesting have seen significant improvements. So this is a great opportunity to explore their possibilities.

In this guide, you will learn how to backtest a trading strategy on the TradingView platform, both manually and automatically. We will explain its current capabilities and limitations and accompany everything with illustrative examples. We will also touch on the topics of trading plans, backtesting spreadsheets, and historical data.

What is TradingView?

TradingView is a versatile trading platform that can be used in a web browser, on a desktop, or on your mobile device. It has gained immense popularity mainly due to its user-friendly interface, advanced technical analysis tools, and easy access to many different markets across asset classes. The basic version of the platform is available for free, which is certainly another factor behind its massive user growth in recent years.

Key Features of TradingView

  • Advanced charting tools: Display various types of charts, such as Renko, Range Bars, Heiken Ashi, and many others.
  • Lots of technical indicators: More than 100 built-in indicators and many more created by users.
  • Pine Script: A powerful, lightweight scripting language for writing custom indicators and strategies.
  • Real-Time Market Data: Free access to real-time data for many crypto and forex markets. Delayed data for futures, stocks, and ETFs in the free version.
  • Replay tool: A simple tool for replaying historical charts bar by bar (candlestick by candlestick)
  • Strategy Tester: A basic but powerful backtesting engine for automated strategies
  • Economic Calendar and News: Built-in calendar for macroeconomic events. Integrated news relevant to your watchlist.
  • Broker Integration: Connect to dozens of supported brokers.
  • Social Networking & Community Features: Share trading ideas, analysis, and scripts with other users.  
  • Screeners: Stock screener, crypto screener, and forex screener help you filter assets based on specific criteria.
  • Alerts System: Set alerts on price levels, indicators, drawing tools, or custom scripts. Alerts can be delivered via app notifications, email, or even webhook integrations.

What You Need for Backtesting on TradingView

To start testing your trading strategy in the TradingView platform, you will need the following:

  1. TradingView trading platform
  2. Historical data
  3. Trading plan
  4. Backtesting spreadsheet (for manual backtesting)

Getting TradingView

If you are not a TradingView user yet, you will need to create a new account and select a plan.

Go to the TradingView website and click on the “Get Started” button.

You will be taken to a page where you need to choose your subscription plan. These differ in various parameters, but in terms of backtesting, we are only interested in two: historical bars and deep backtesting.

The historical bars parameter determines the number of intraday bars (candles) that can be displayed on the chart. For example, if you choose the Premium plan, you can load up to 20,000 1-minute candles. This limitation does not apply to the daily time frame and higher, regardless of the plan you choose.

A TradingView user who backtests manually would be perfectly happy with the Basic (free) plan, which offers a history of 5,000 bars. However, this option does not come with a replay tool, so you need to choose at least the Essential plan.

In the case that you want to use TradingView for automated backtesting, your decision will be a little more complicated, as the platform allows you to perform two types of automated backtesting:

  1. Automated backtesting on chart data.
  2. Automated backtesting on the entire data set (entire history) using the deep backtesting function.

With the Basic plan, you can only backtest approximately 15 years of daily, weekly, and monthly data. While this is not a lot, it is certainly enough for a basic introduction to automated backtesting in TradingView.

However, if you are really serious about automated backtesting, you should opt for the Premium plan, which includes the aforementioned deep backtesting feature. In this case, you will not be limited in any way and can backtest any historical period, as you will see later.

Historical Data

In order to perform manual or automated backtesting, you will need a sufficient amount of historical data. Unlike other platforms, TradingView only allows its users to work with data stored on its servers. This means that you cannot import your own data into the platform. So if you want to backtest an instrument (market) that has no historical data on the servers, you’re out of luck. Fortunately, such cases will be very rare.

The range of historical data available on TradingView is quite decent. You can backtest forex, cryptocurrency, stock, futures, or ETF markets, as well as indices such as DXY or VIX.

The depth of historical data is also satisfactory. For the vast majority of instruments, you can view the complete history of daily data and a relatively large quantity of 1-minute data, in some cases going back as far as 2000.

Scalpers will certainly be interested in the fact that TradingView has been collecting second-by-second data since August 2022. This makes chart replay more realistic, allowing for more sophisticated backtesting.

Unfortunately, second-by-second data is the lowest type of data that can be found in TradingView today. If you need historical tick data for your backtesting, you will have to choose an alternative, such as Sierra Chart or NinjaTrader.

It is also worth noting that some instruments can be backtested using historical data from various providers. For example, if you decide to test your strategy on the EURUSD forex pair, you can choose which broker the data will come from. This is a significant advantage, particularly in the forex world, where some brokers are notorious for their poor data quality.

Trading Plan

Before you start backtesting, you should write down the rules of your strategy in the form of a simple trading plan and then archive it together with the backtest results. Why, you ask? Well, the answer is quite simple.

As the number of backtests you perform over time gradually increases, you will most likely forget what you have already tested and how. However, a carefully written trading plan will always refresh your memory, so there is no risk of losing track.

The topic of trading plans is covered in depth in the How To Backtest a Trading Strategy guide, so there is no need to repeat information that has already been published. It also provides an excellent example of what a trading plan should look like and what sections it should contain. Therefore, please pay close attention to it, as properly created trading plans will make your work easier.

Backtesting Spreadsheet

Today, all backtesting software can record executed trades and use them to calculate important metrics such as profit factor, average trade, win rate, and so on. However, every professional trader knows very well that when backtesting manually, collecting only basic data is not enough.

During this process, many nuances can be observed that can later be used as filters, sometimes leading to dramatic improvements in strategy performance. So if you want to perform sophisticated backtesting with additional data collection, you will need something called a backtesting spreadsheet.

A backtesting spreadsheet is a specially designed spreadsheet that allows you to record and evaluate data. It is most often created using spreadsheet processors such as Microsoft Excel or Google Sheets.

A well-designed backtesting spreadsheet allows you to categorize trades (A, B, C, etc.), catalogue screenshots before and after entering a trade, record market conditions or current intermarket relationships, and a host of other valuable information that you can work with later. It enables you to document and analyze anything you deem important. This is something that no backtesting software can offer you.

As with the trading plan, the backtesting manual also covers the backtesting spreadsheet in detail. Therefore, this topic will not be discussed further here.

However, to get a quick idea of what a well-designed backtesting spreadsheet should look like, check out the Backtesting Club Trading Journal.

Manual Backtesting in TradingView

The first thing you need to do at the beginning of each backtesting session is to load historical market data. The following example shows how to do this for expired futures contracts.

Open the TradingView trading platform and switch the current chart to a 1-minute time frame to avoid look-ahead bias. You don’t want to see the historical data you’re going to backtest in advance. This step is therefore very important!

Next, click the Symbol Search field in the main panel to find the market you want to backtest. Alternatively, you can start typing the ticker (instrument abbreviation) on your keyboard, which should also bring up the Symbol Search window.

For example, we can choose the NQ futures market with delivery in March 2023.

As you can see in the screenshot below, TradingView appears to have no data for this expired futures contract. Don’t be discouraged by this, though, and press enter. The market chart will then load immediately.

We will backtest manually using the Bar Replay tool. To do this, click on the Replay button in the main panel.

Now you will need to move to the beginning of the period you want to backtest. The Bar Replay tool offers the following options for this purpose:

  • Select bar
  • Select date
  • Select the first available date
  • Random bar

If you have never used the Bar Replay tool before, it will be set to Select Bar by default.

However, we want to move to a specific location in the chart without having to see the already-created candles (bars). Therefore, use the Select date option and select the date and time of the start of your backtesting session.

After the chart moves to where you want it, there are only two last things to set. Playback speed and update interval.

What values to choose is a highly individual matter. However, you should set these parameters so that you can comfortably capture your strategy setups during playback.

Once you have everything set up the way you want, you can start replaying the chart smoothly by pressing the Play button or step by step with the Forward button.

When the conditions for entering and exiting a trade arise, write down all important values, notes, and facts in your backtesting spreadsheet. To read the data, you may find the Data Window useful; you can open it by clicking the icon indicated by the arrow in the screenshot.

The Bar Replay tool also allows you to simulate trades as if they were executed in a live market. If you want to use this feature, click on the Trade button on the bottom panel.

The example shown only demonstrates backtesting in one window. However, it is also possible to replay multiple windows and instruments at once. Therefore, backtesting strategies that use elements such as multi-timeframe or intermarket analysis are not a problem.

To end or terminate your backtesting session, click the cross icon. The next time you activate the Bar Replay tool, TradingView will offer to continue where you left off.

At the end of this section, it is also necessary to mention the current limitations of the Bar Replay tool. Despite the fact that developers are constantly working hard to improve it, there are still a few things it cannot do. In particular, this concerns the replay of the following chart types:

  • Renko charts
  • Kagi charts
  • Point and Figure charts
  • Range bars
  • Line Break charts
  • Volume Footprint charts
  • Time Price Opportunity charts
  • Tick-based charts

However, don’t despair. There is always a solution to every problem.

If your strategy uses any of the above charts, the best way to backtest it is with the Sierra Chart trading platform.

Automated Backtesting in TradingView

TradingView also allows users to run automated backtests with the built-in Strategy Tester. To use this feature, you will need an automated strategy created in the PineScript programming language. There are several ways to obtain such an algorithm:

  1. Learn Pine Script and create your own automated strategy in Pine Editor.
  2. Hire a programmer to create an automated strategy according to your specifications.
  3. Use the built-in automated strategy already available in TradingView.
  4. Use one of the free automated strategies created by the TradingView community.
  5. Purchase an automated trading strategy.
  6. Create your own automated strategy using artificial intelligence tools such as ChatGPT, Google Gemini, and the like.
  7. Create your own automated strategy using a strategy builder such as Pineify or Pine Script Wizard.

As you can see, there are many options available. In this tutorial, we will focus on just two: built-in strategies and community-provided strategies.

Let’s start with the latter option.

Automated Backtesting Using a Free Community Strategy

Go to the TradingView website and click on Community in the top menu. Then select Strategies as a filter.

Take your time and thoroughly review each strategy. Once you find one that interests you, copy its name to the clipboard (Ctrl+C). Next, click on Indicators in the TradingView main panel and, after the window opens, paste the contents of your clipboard into the search field (Ctrl+V). Then click on your chosen automated strategy.

Once the strategy is loaded, a backtest will immediately be performed on the instrument and time frame currently displayed in the chart. But don’t worry about this slowing you down. The Strategy Tester performs automated backtesting relatively quickly. This process usually takes only a few seconds.

Now that the strategy is loaded, you can start configuring it. If you haven’t already done so, start by selecting the instrument and timeframe you want to backtest.

As you can see, whenever you make a change, the Strategy Tester will rerun the backtest. This is a feature specific to this backtesting engine and cannot be disabled.

The default backtest is always performed on the chart data. However, in most cases, this is insufficient. If your subscription plan includes Deep Backtesting, select a sufficiently long period so that the backtest results are meaningful. You can do this by clicking the displayed dates, then selecting the “Custom date range” option.

Enter the start and end dates of the backtest period.

Next, you will need to set the strategy and how the Strategy Tester should perform the automated backtest. Click the strategy name to open the menu. Then select Settings. For a faster process, you can also use the keyboard shortcut Ctrl+P.

On the Inputs tab, you can adjust the strategy parameters as you see fit. What can be modified always varies and depends on the strategy developer.

Once you have set up the strategy to your liking, move to the Properties tab to configure the Strategy Tester itself.

Here, you can set basic things such as the initial capital base currency, commission, or slippage. However, some settings require an understanding of how the TradingView Strategy Tester works. Therefore, do not proceed without studying the official documentation for Strategy Properties.

When you are familiar with the Strategy Tester’s capabilities and limitations, set everything as you deem necessary. In our example, we want the backtest to be as realistic as possible, so we will enter commission and slippage values. We will also not forget to activate the critical Bar magnifier function.

Complete the setup by clicking the Ok and Update Report buttons, then let the Strategy Tester perform the final backtest.

After running an automated backtest, you can begin studying the strategy’s basic metrics. The Strategy Tester divides them into several separate windows.

Overview window

Performance window

Trades analysis window

Risk or performance ratios window

In the last window, you will find a list of executed trades, including all details.

List of executed trades window

You can also review the executed trades using the chart. However, please note that the number of bars (candles) loaded is determined by your TradingView plan. Therefore, you may not see all the trades that the strategy has made.

Note: As this example shows, adjusting a few parameters of the backtesting engine can dramatically change the strategy’s results. Therefore, always try to make your backtest as realistic as possible.

To end your backtesting session, you will need to remove the automated strategy. In the right panel, click the icon to open the Object Tree. Then, hover your cursor over your strategy name and use the trash can icon to delete it.

Automated Backtesting Using Built-in TradingView Strategies

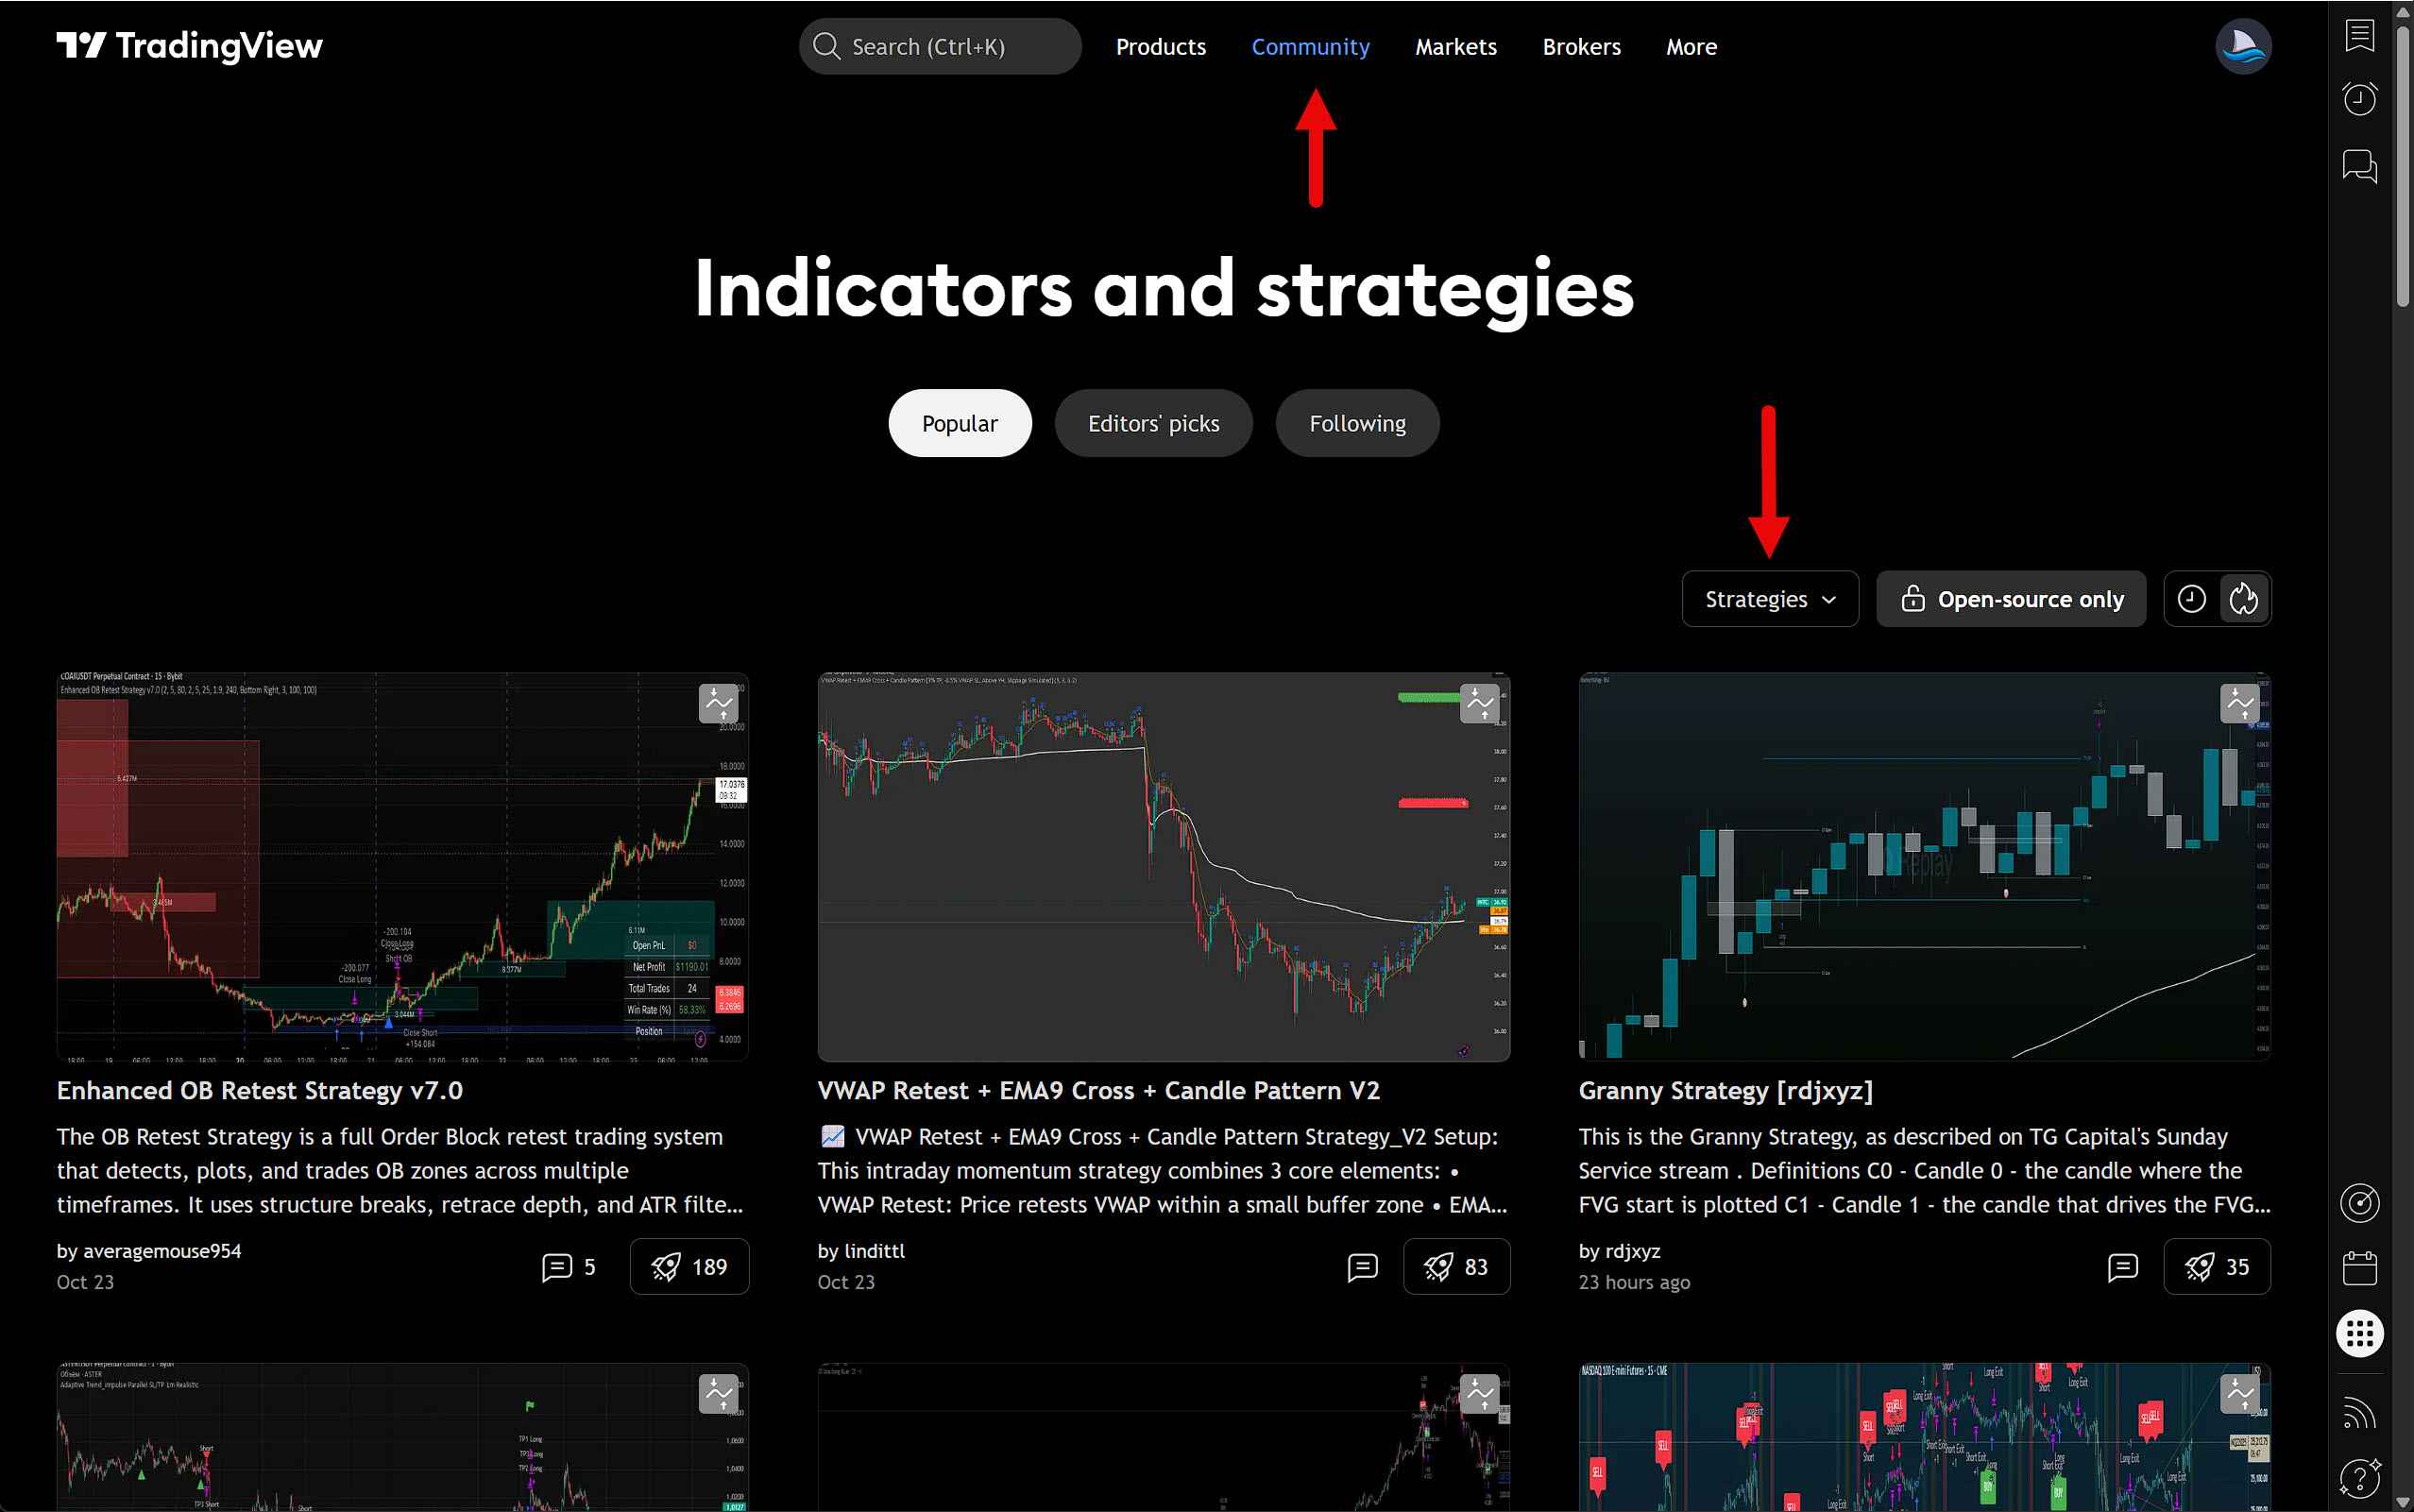
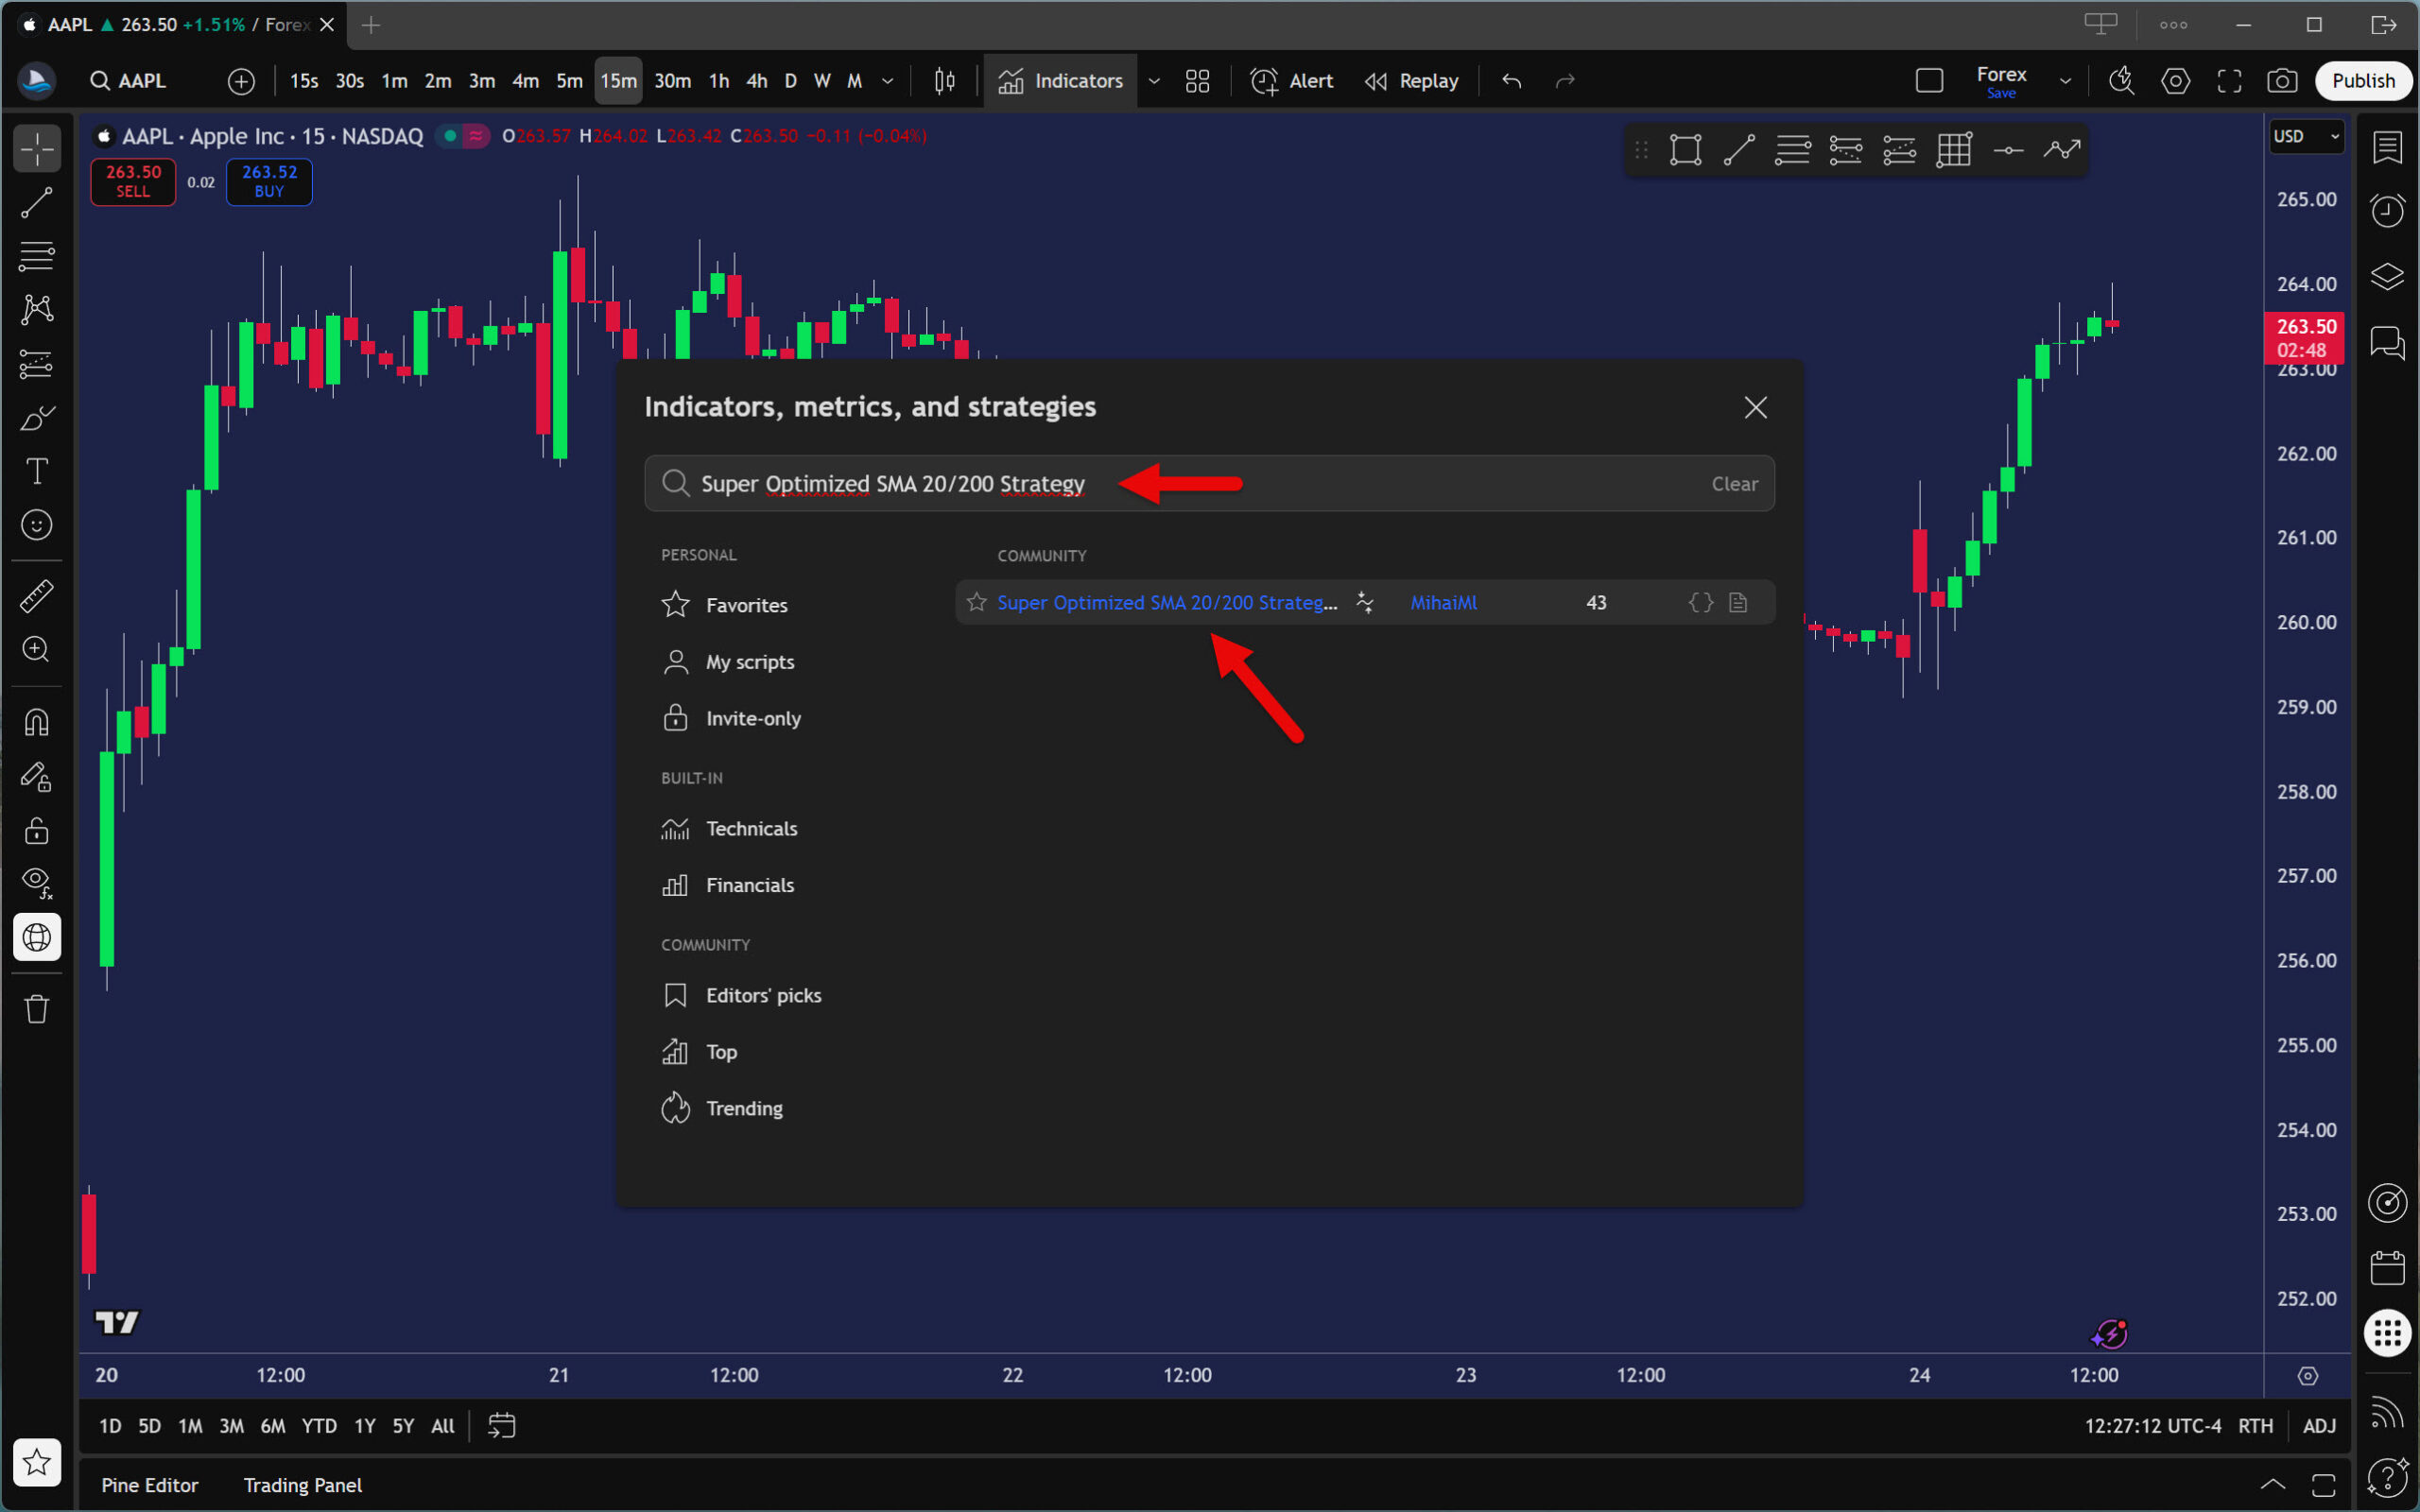
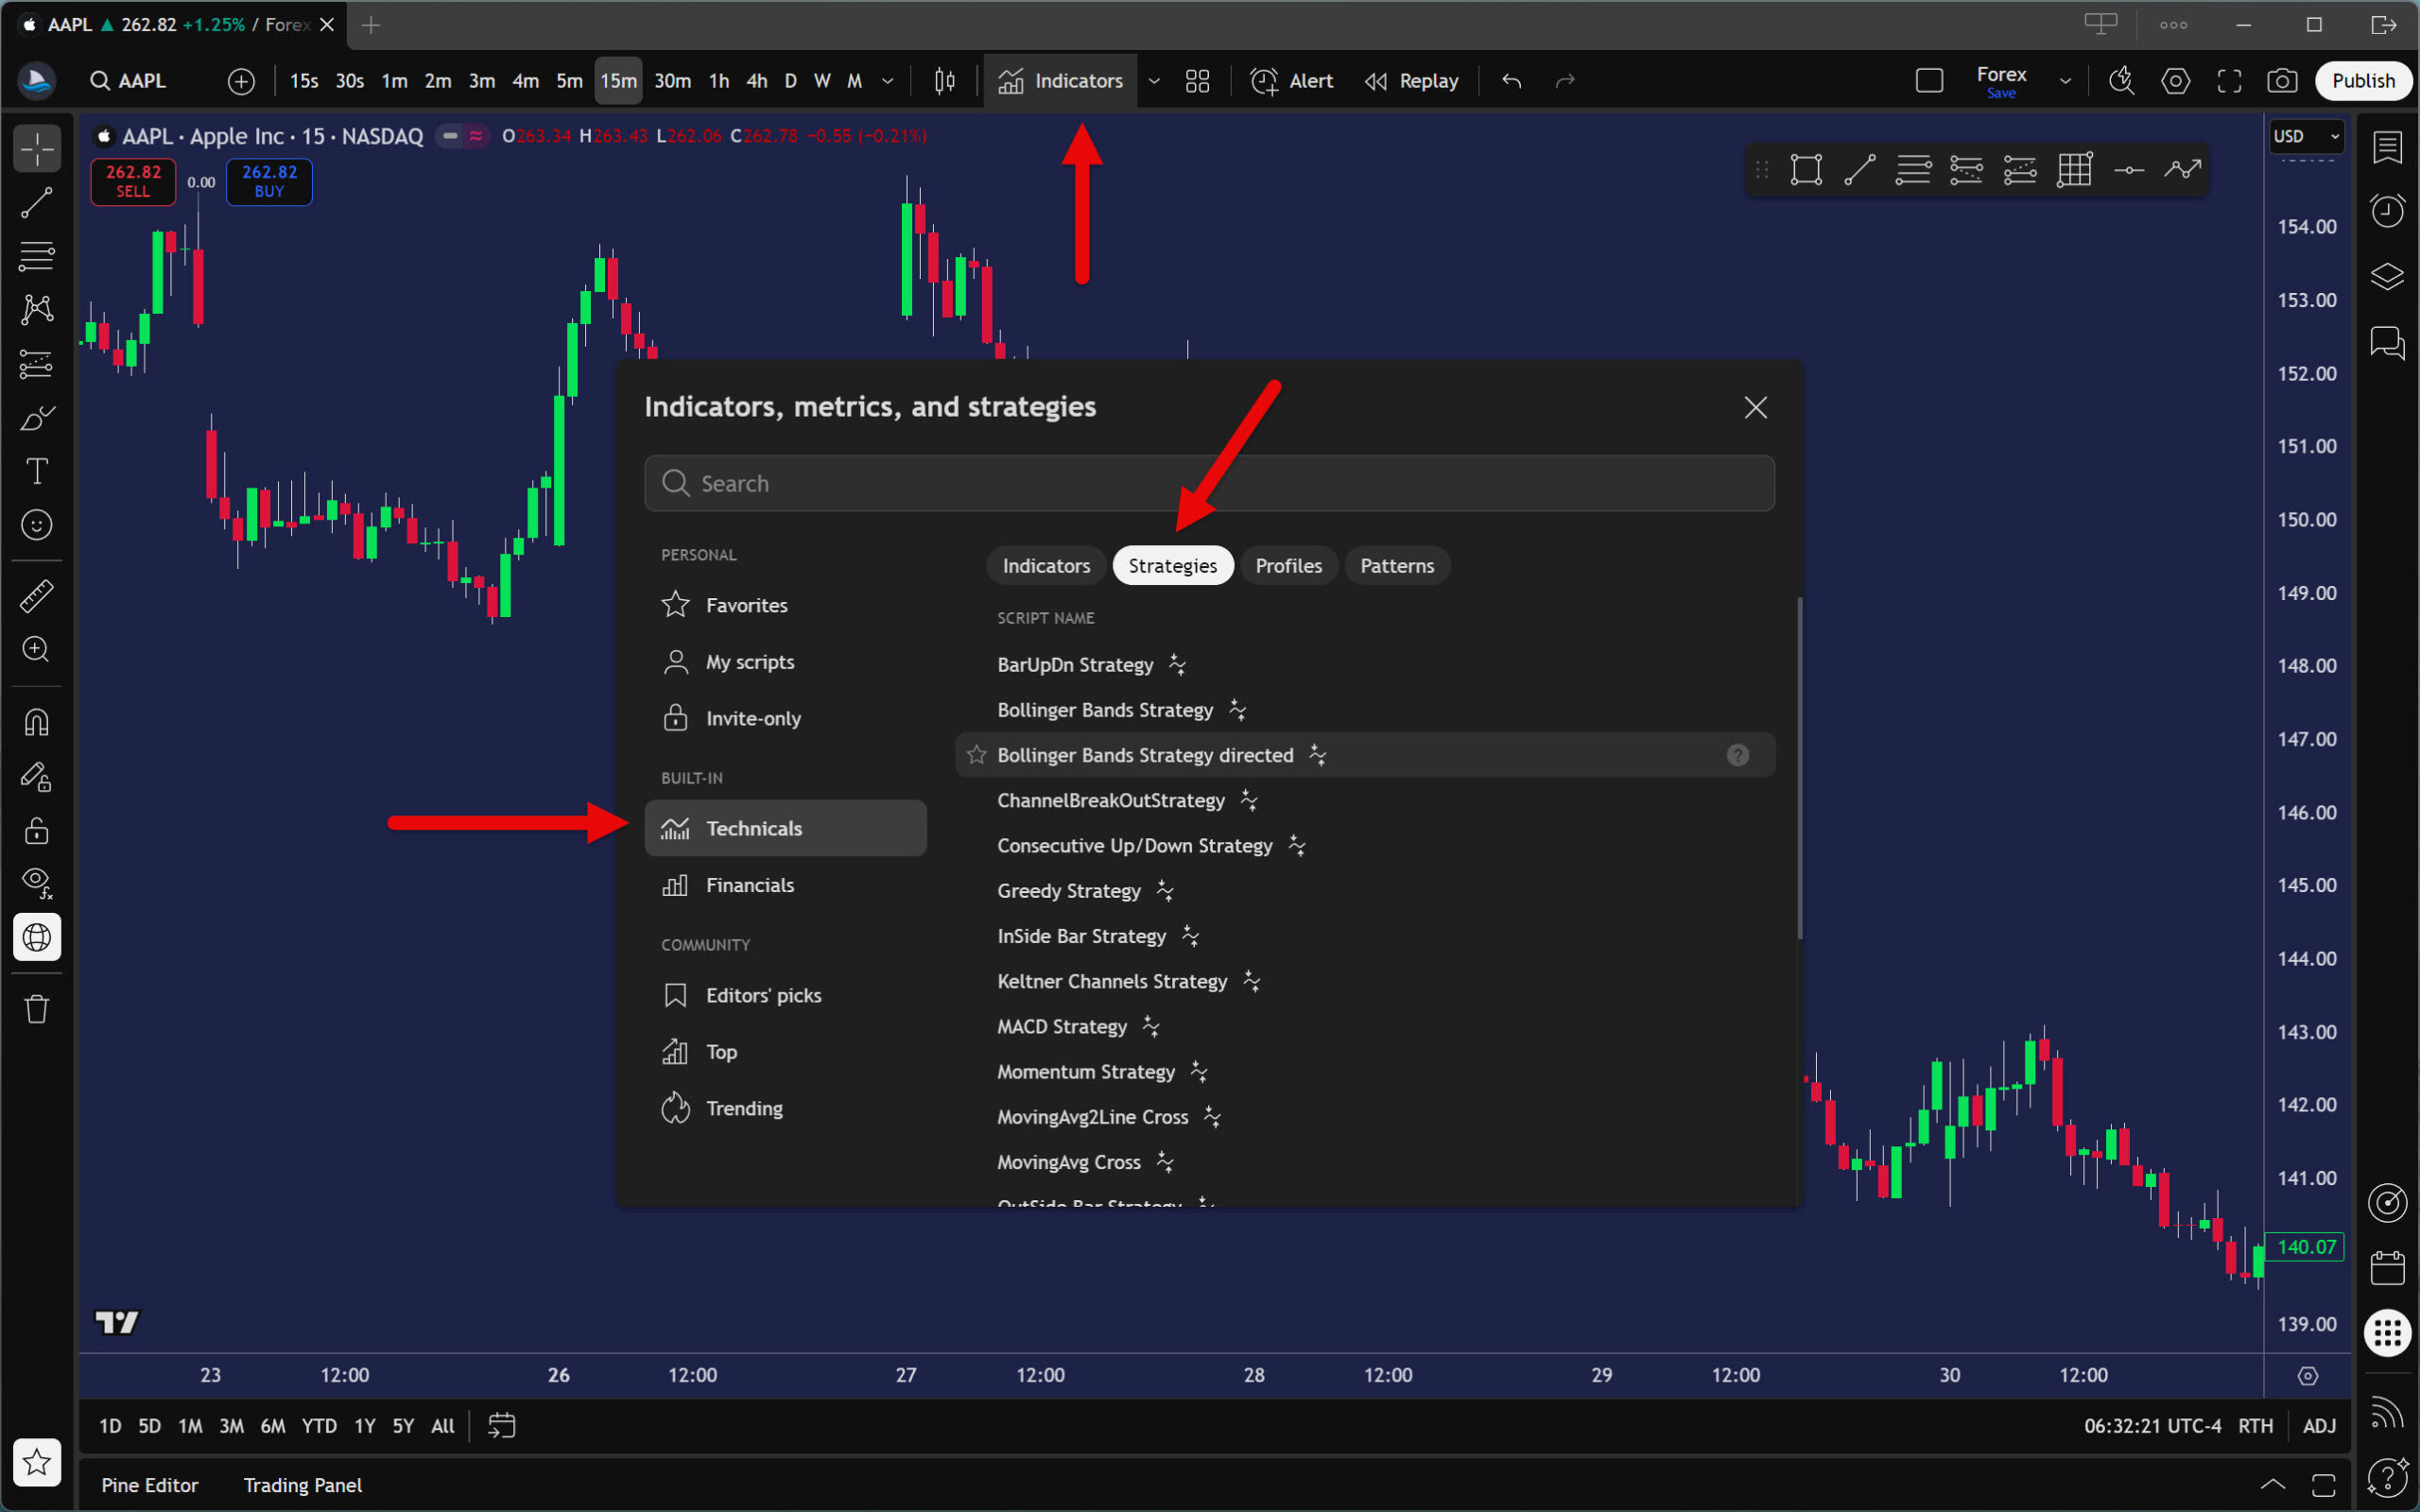
If you haven’t found anything interesting to backtest on the community page, try looking at the built-in strategies. In the TradingView main panel, click on the Indicators button. Then, in the newly opened window, go to Technicals and select the Strategies filter.

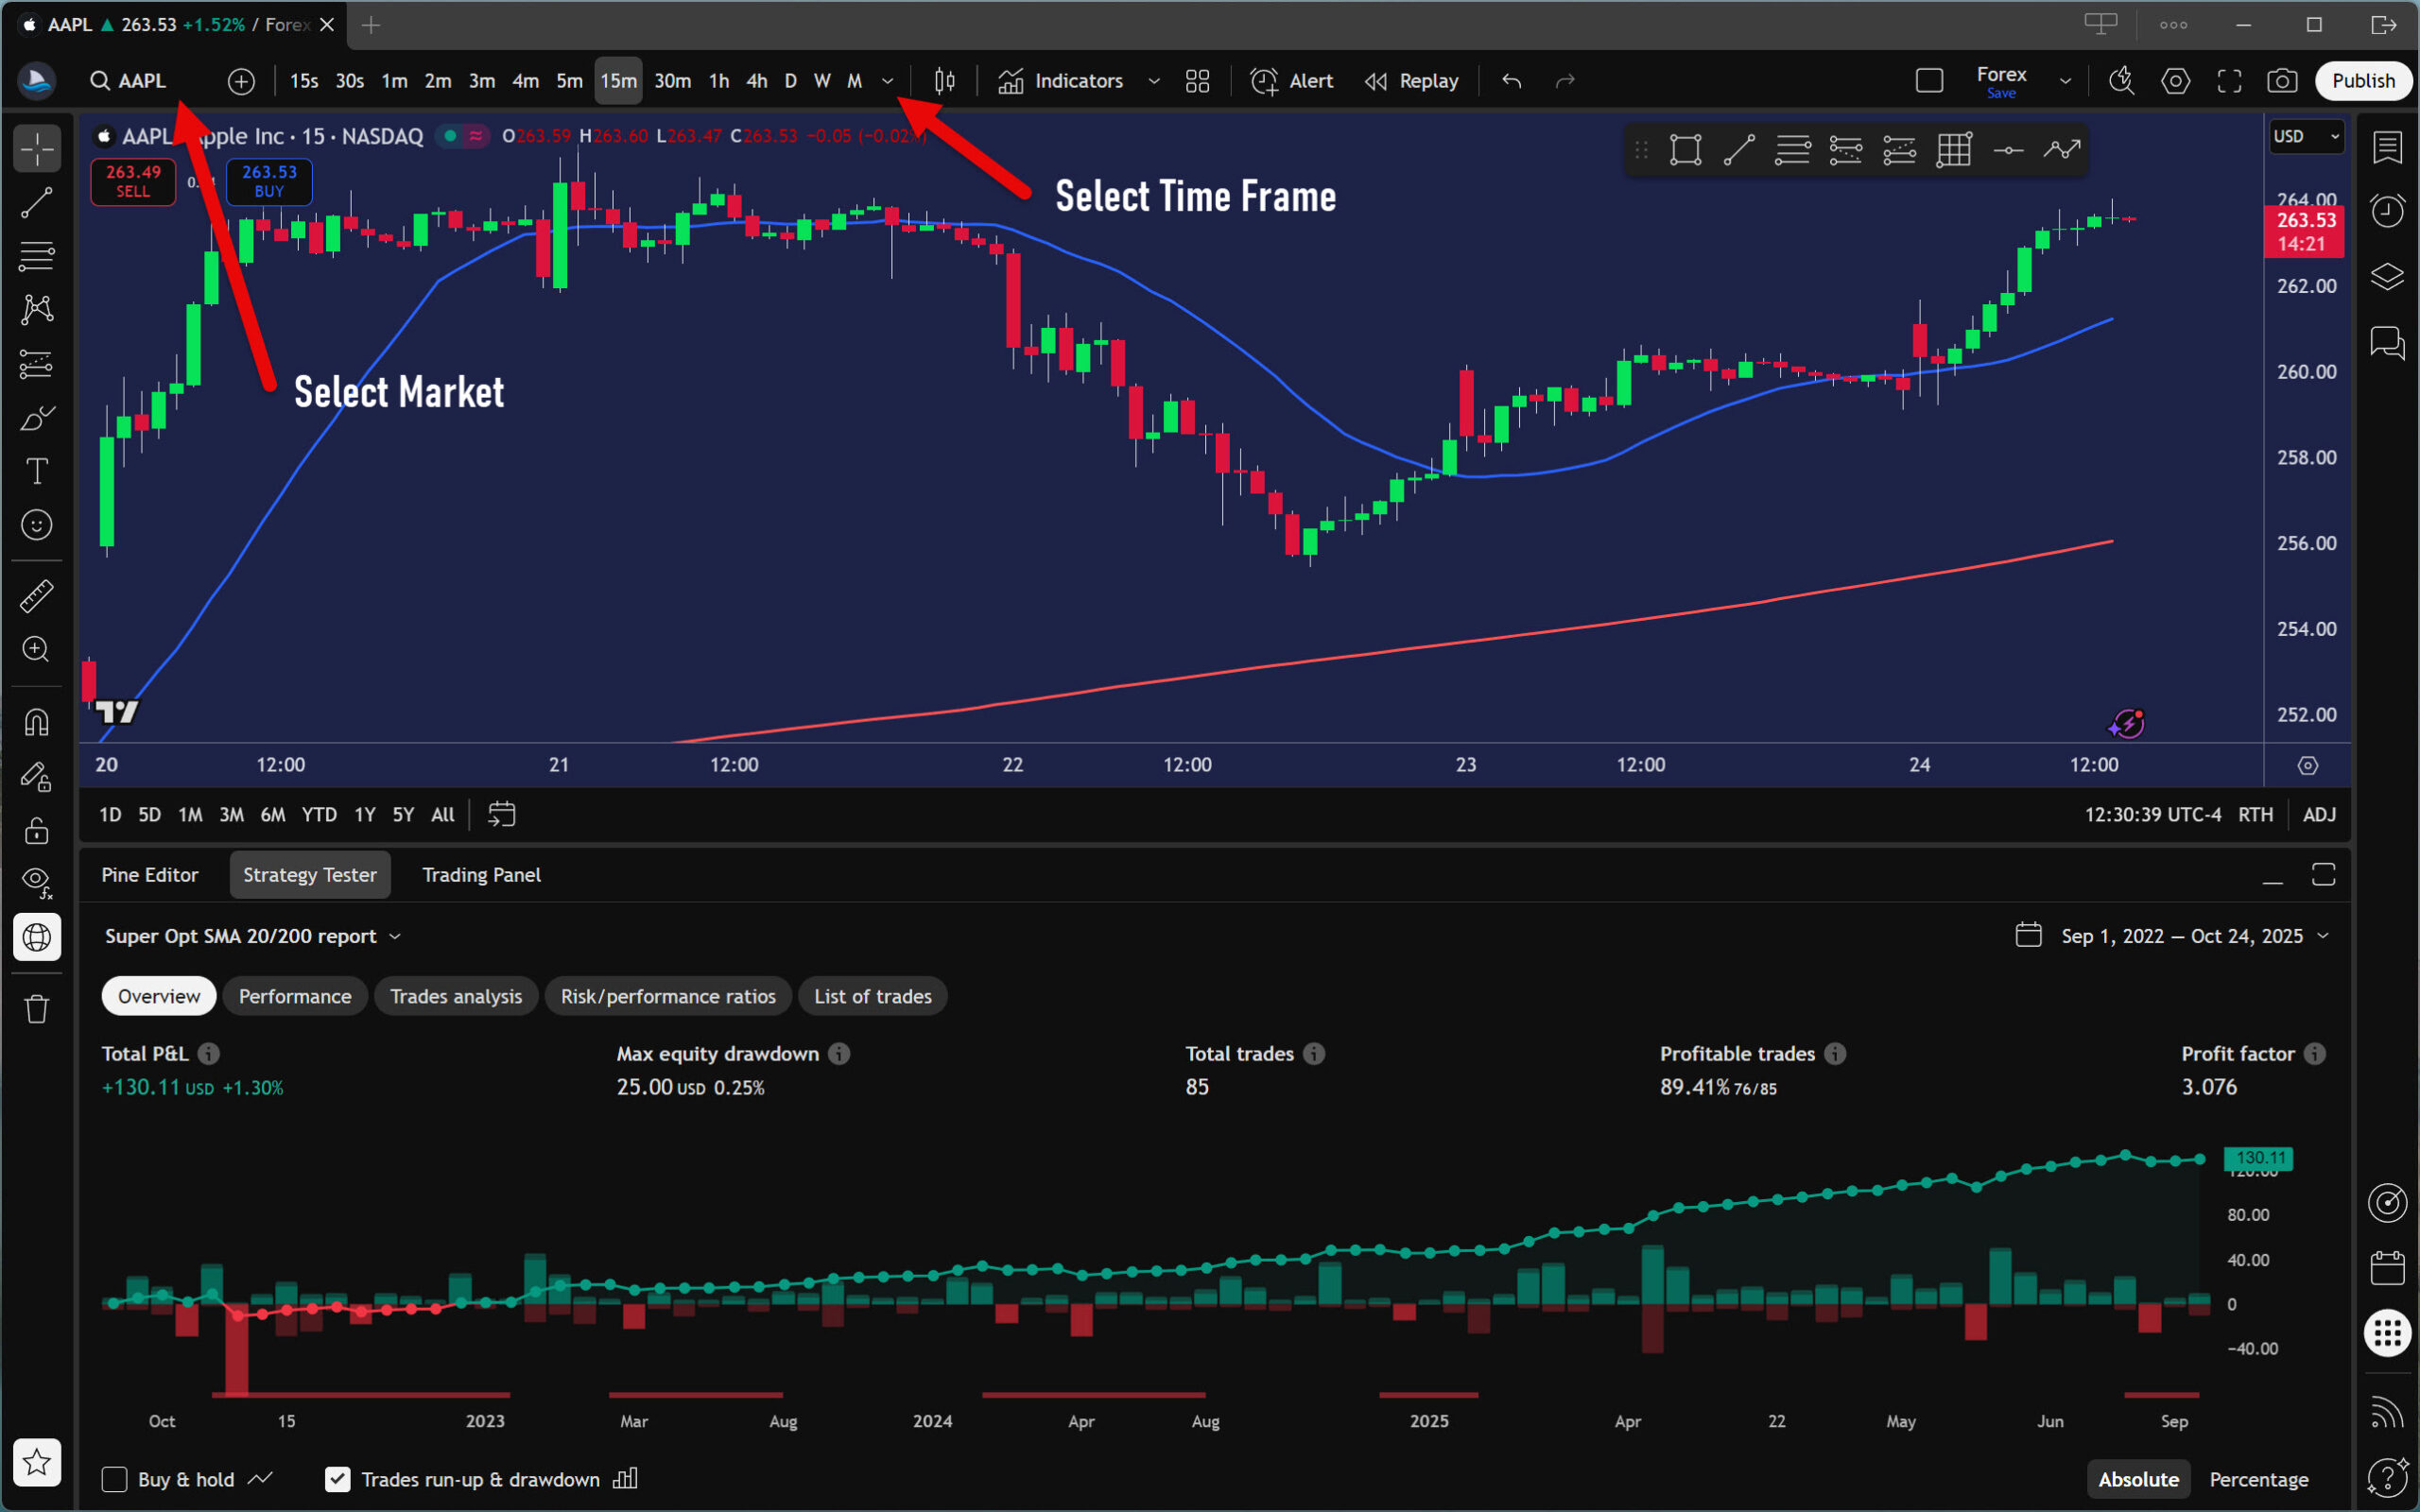
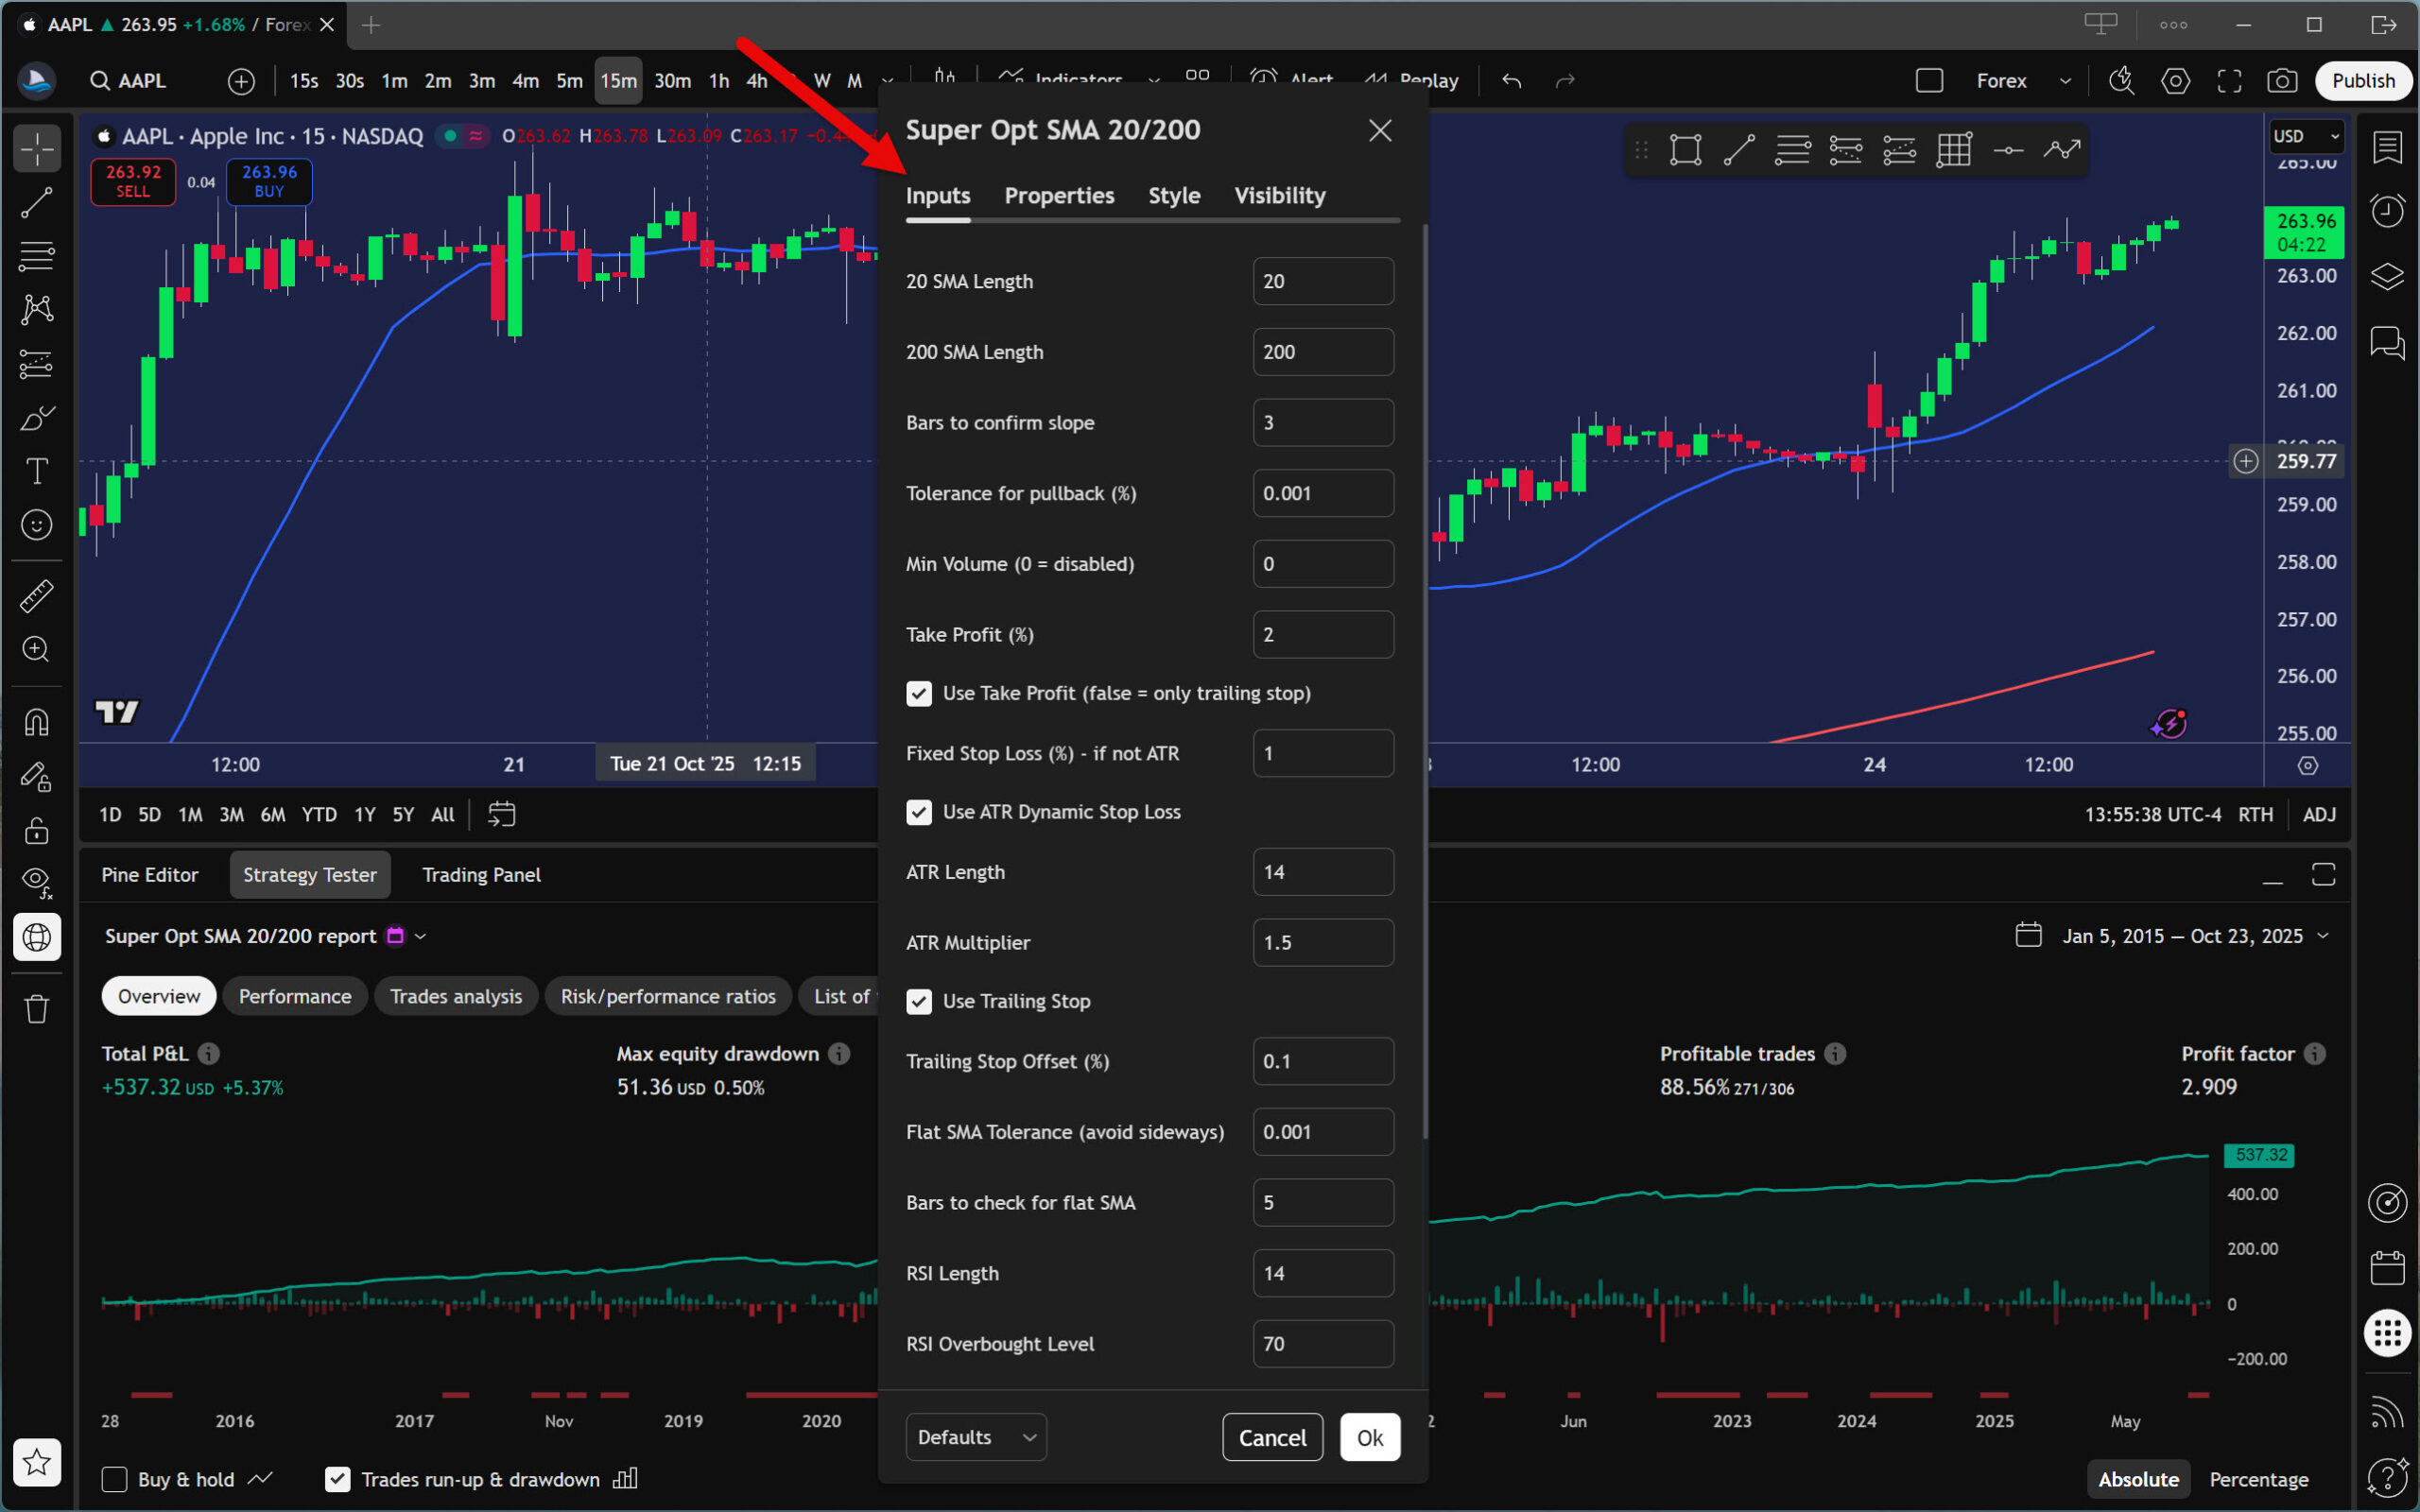
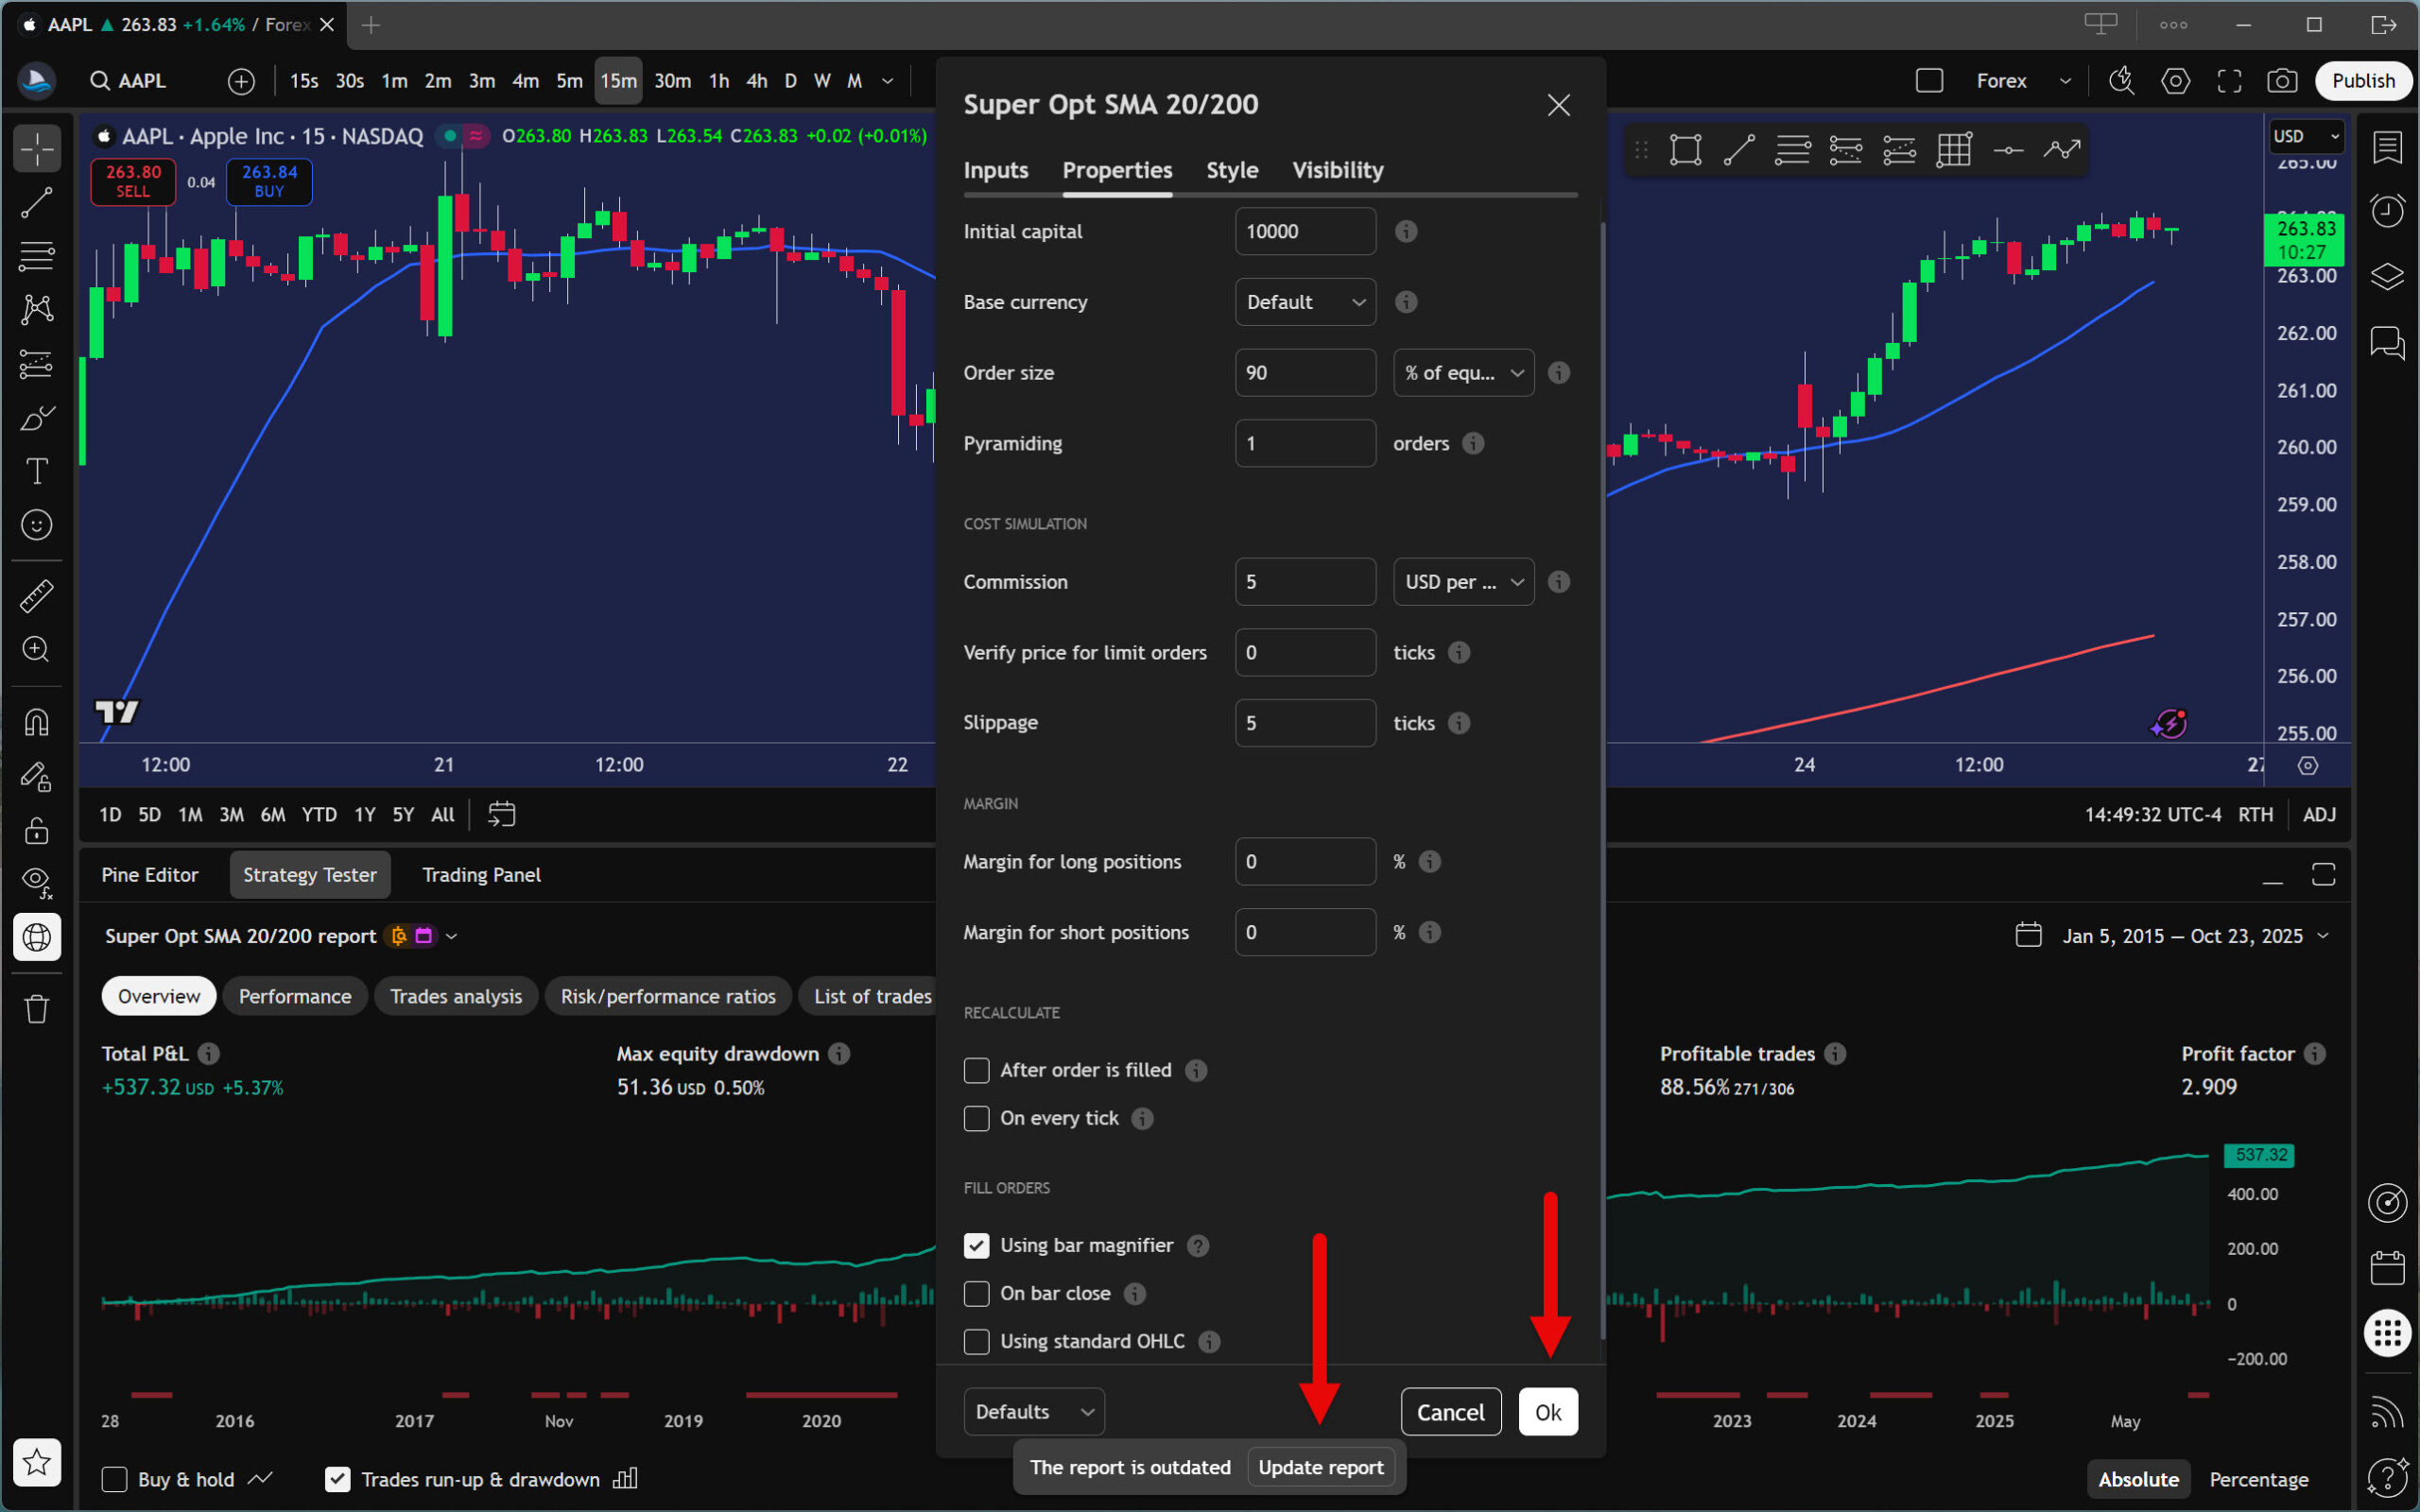
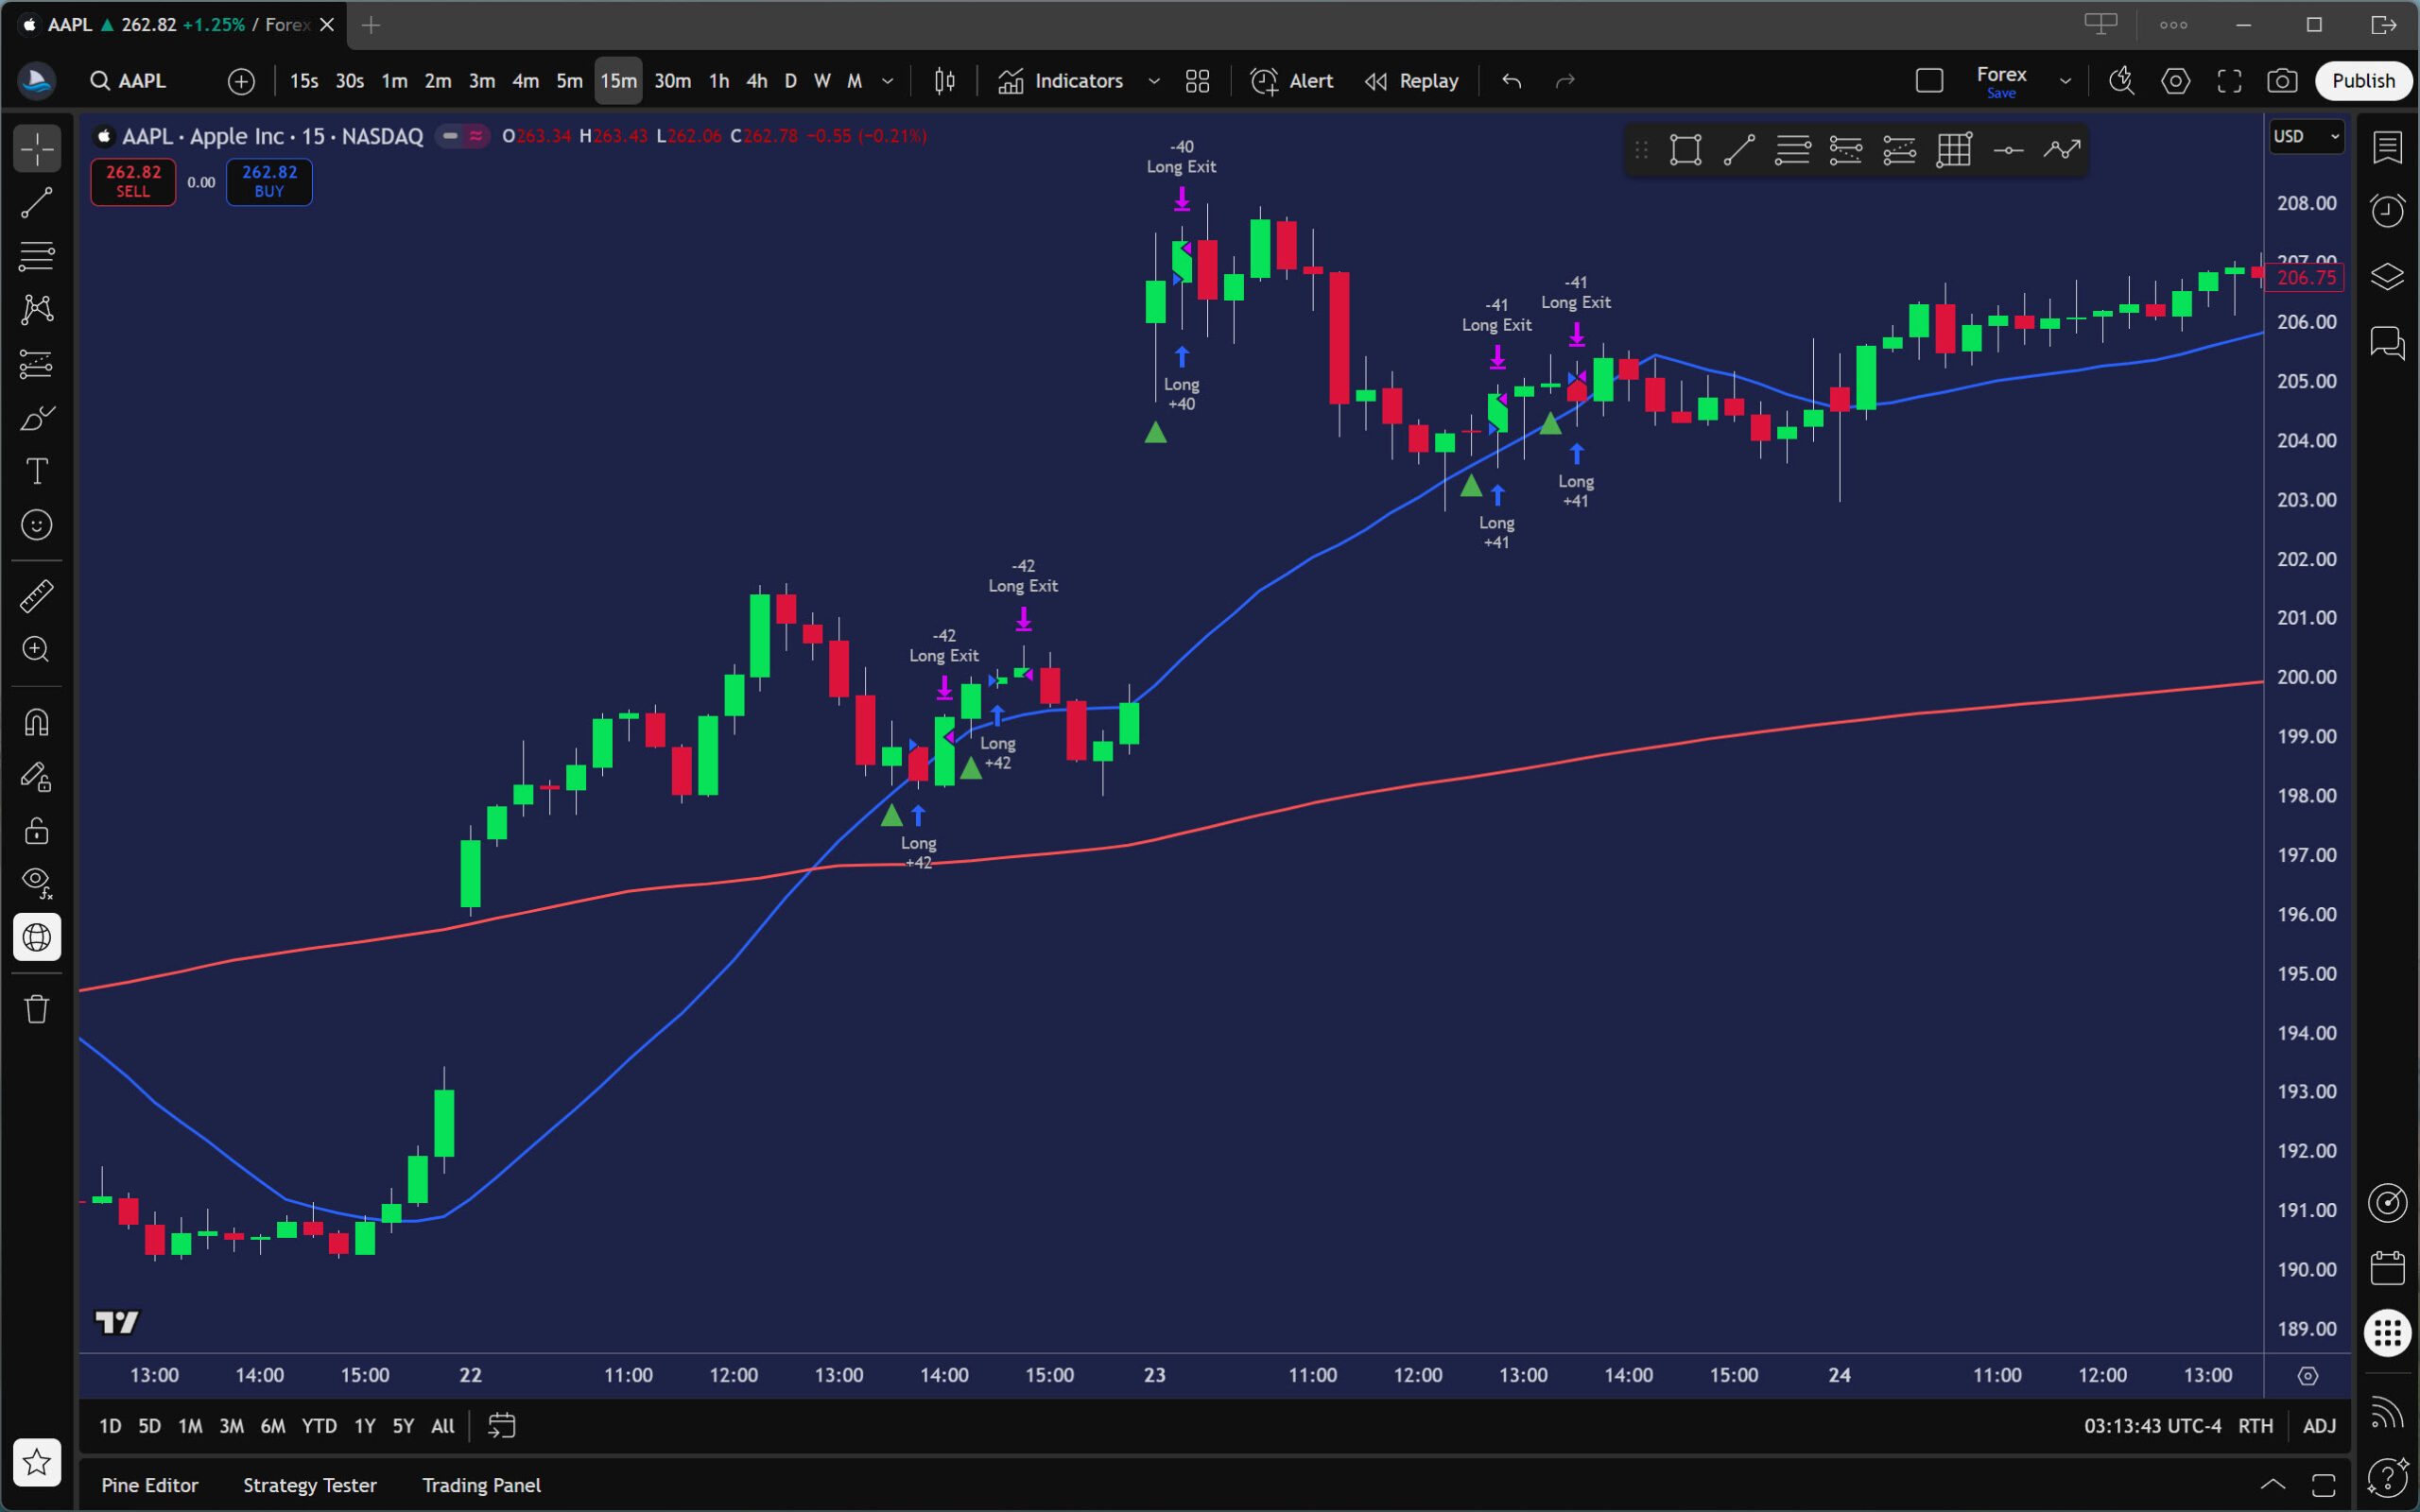
As you can see, there are several simple automated strategies here. If one appeals to you, load it by clicking its name, then proceed as in the previous example.

Limitations of Automated Backtesting in TradingView

Although the Strategy Tester is constantly being improved and expanded with new features, it is not yet a tool for sophisticated backtesting of automated strategies.

The main reasons for this are the following limitations:

  • Only one time frame can be backtested.
  • Inability to backtest multiple instruments at once (portfolio backtesting).
  • Strategy Tester cannot backtest offline.
  • It is not possible to define the accuracy of backtesting (for example, tick-by-tick precision).
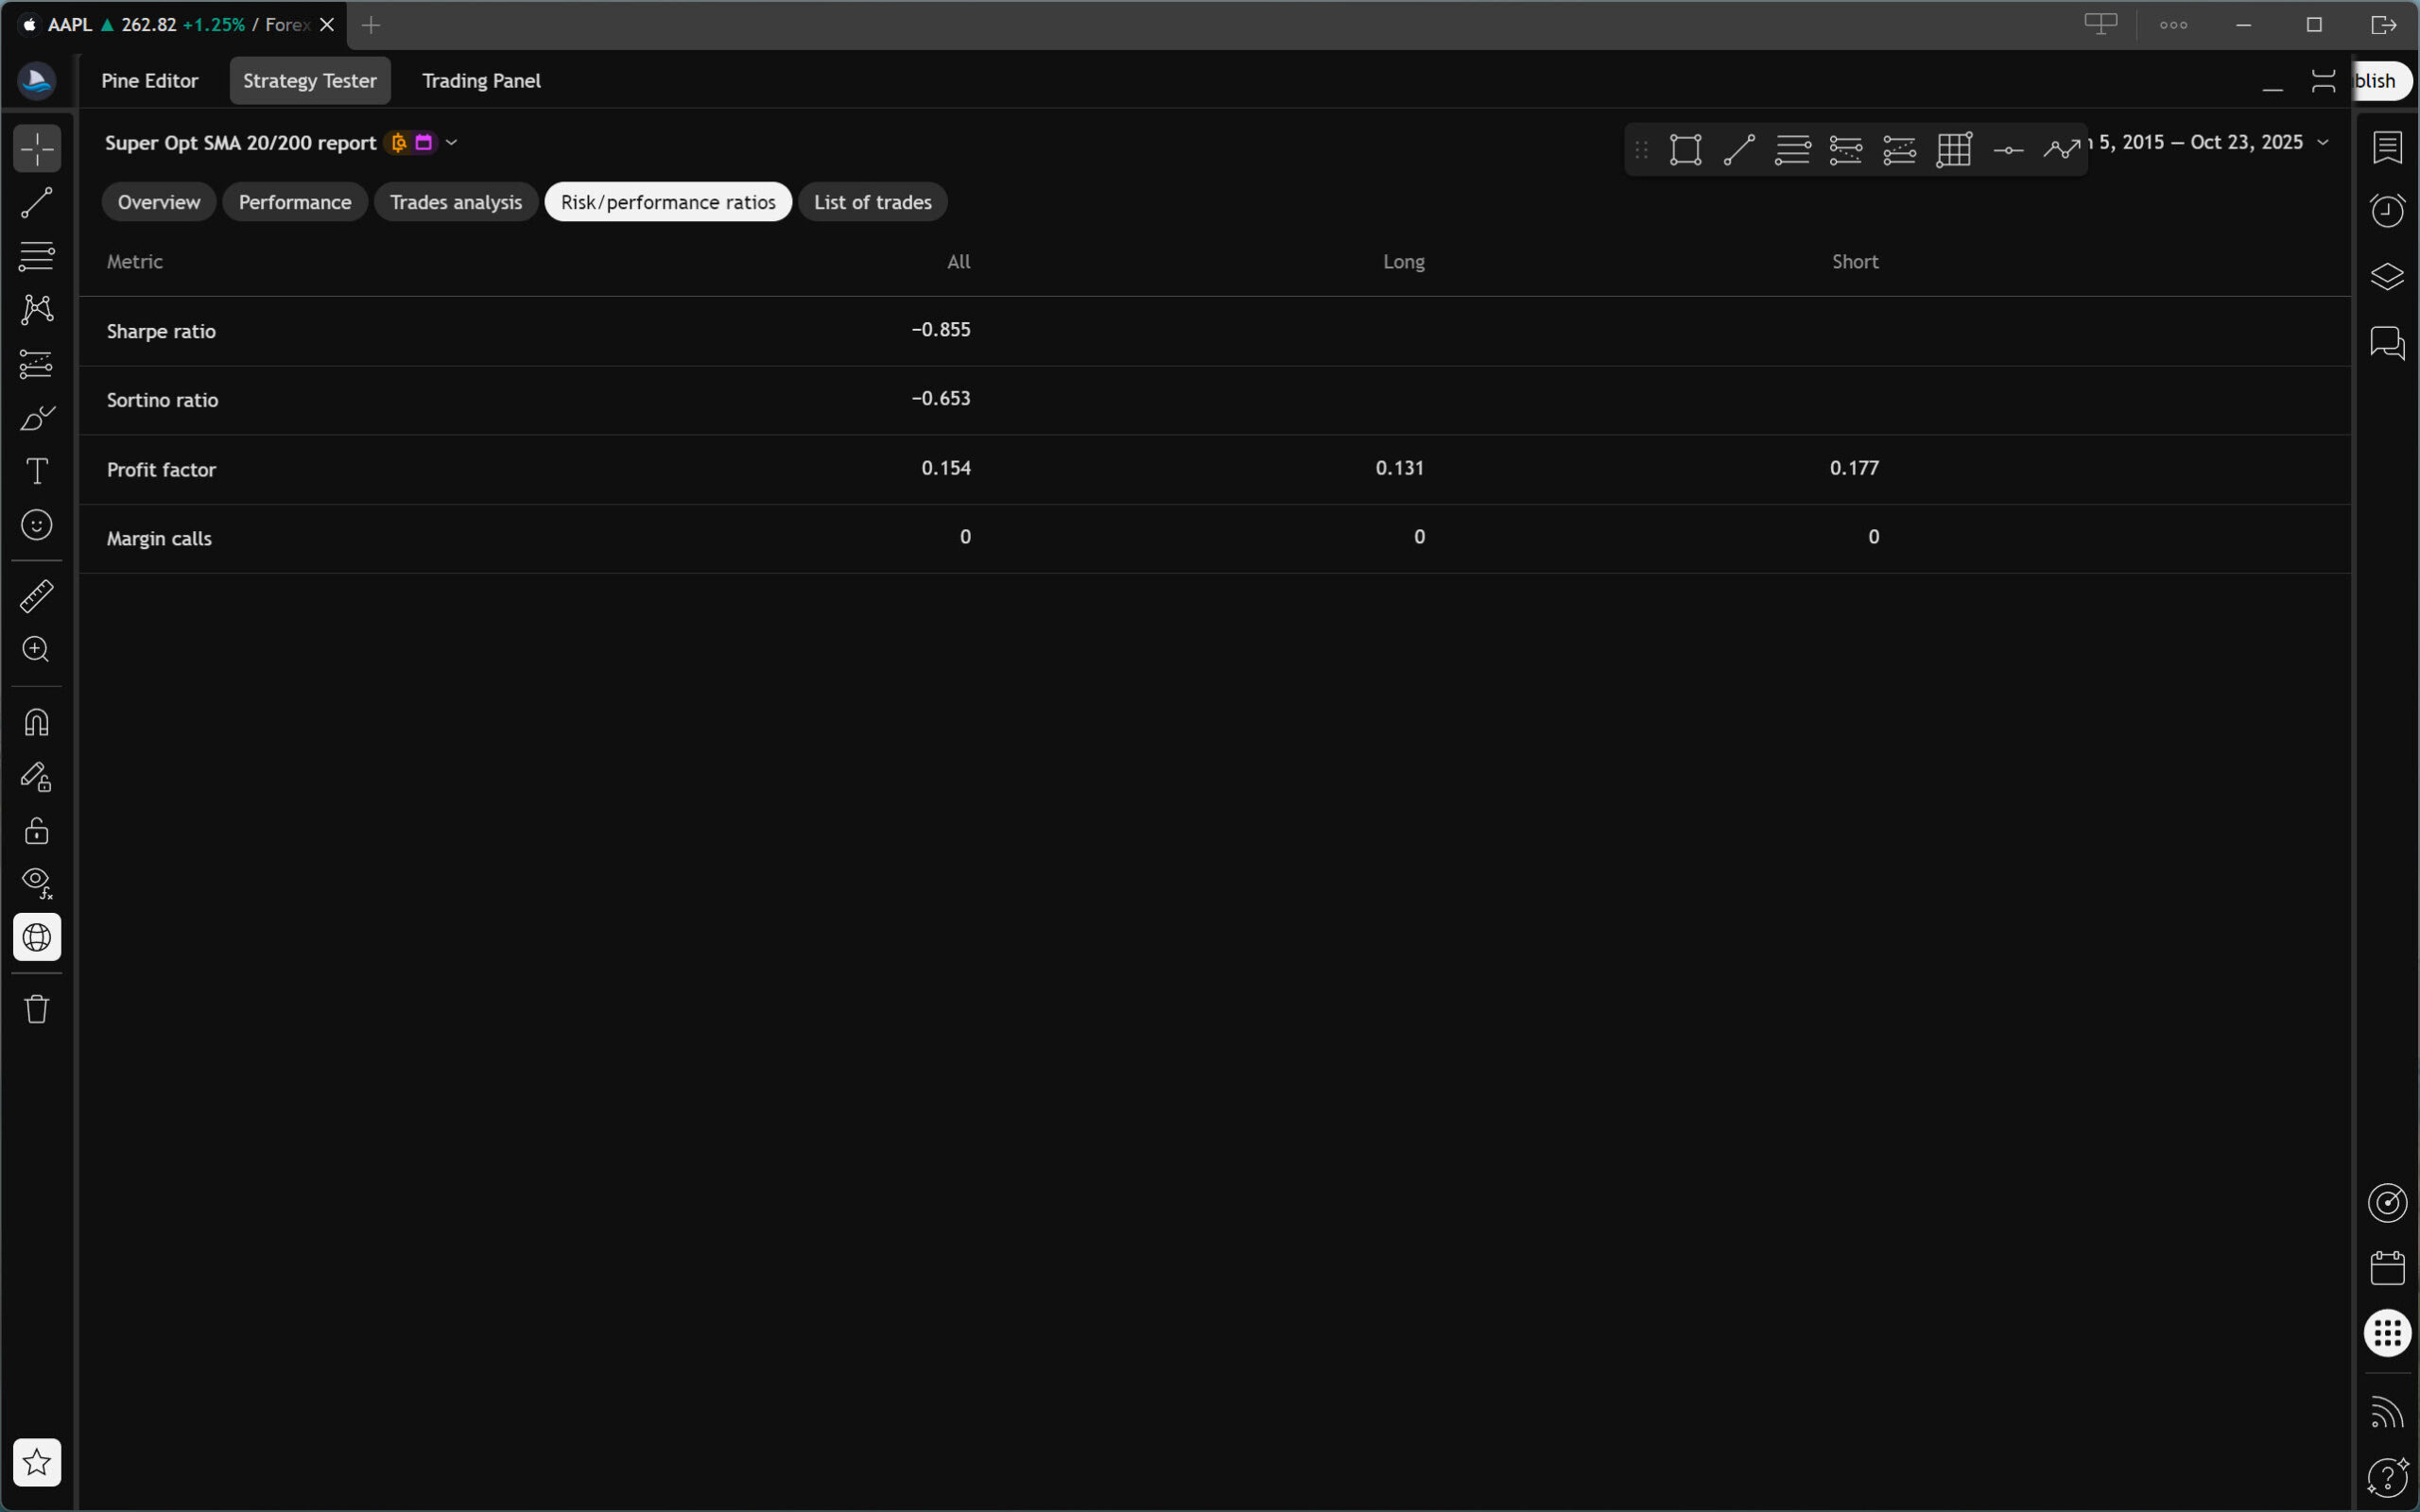
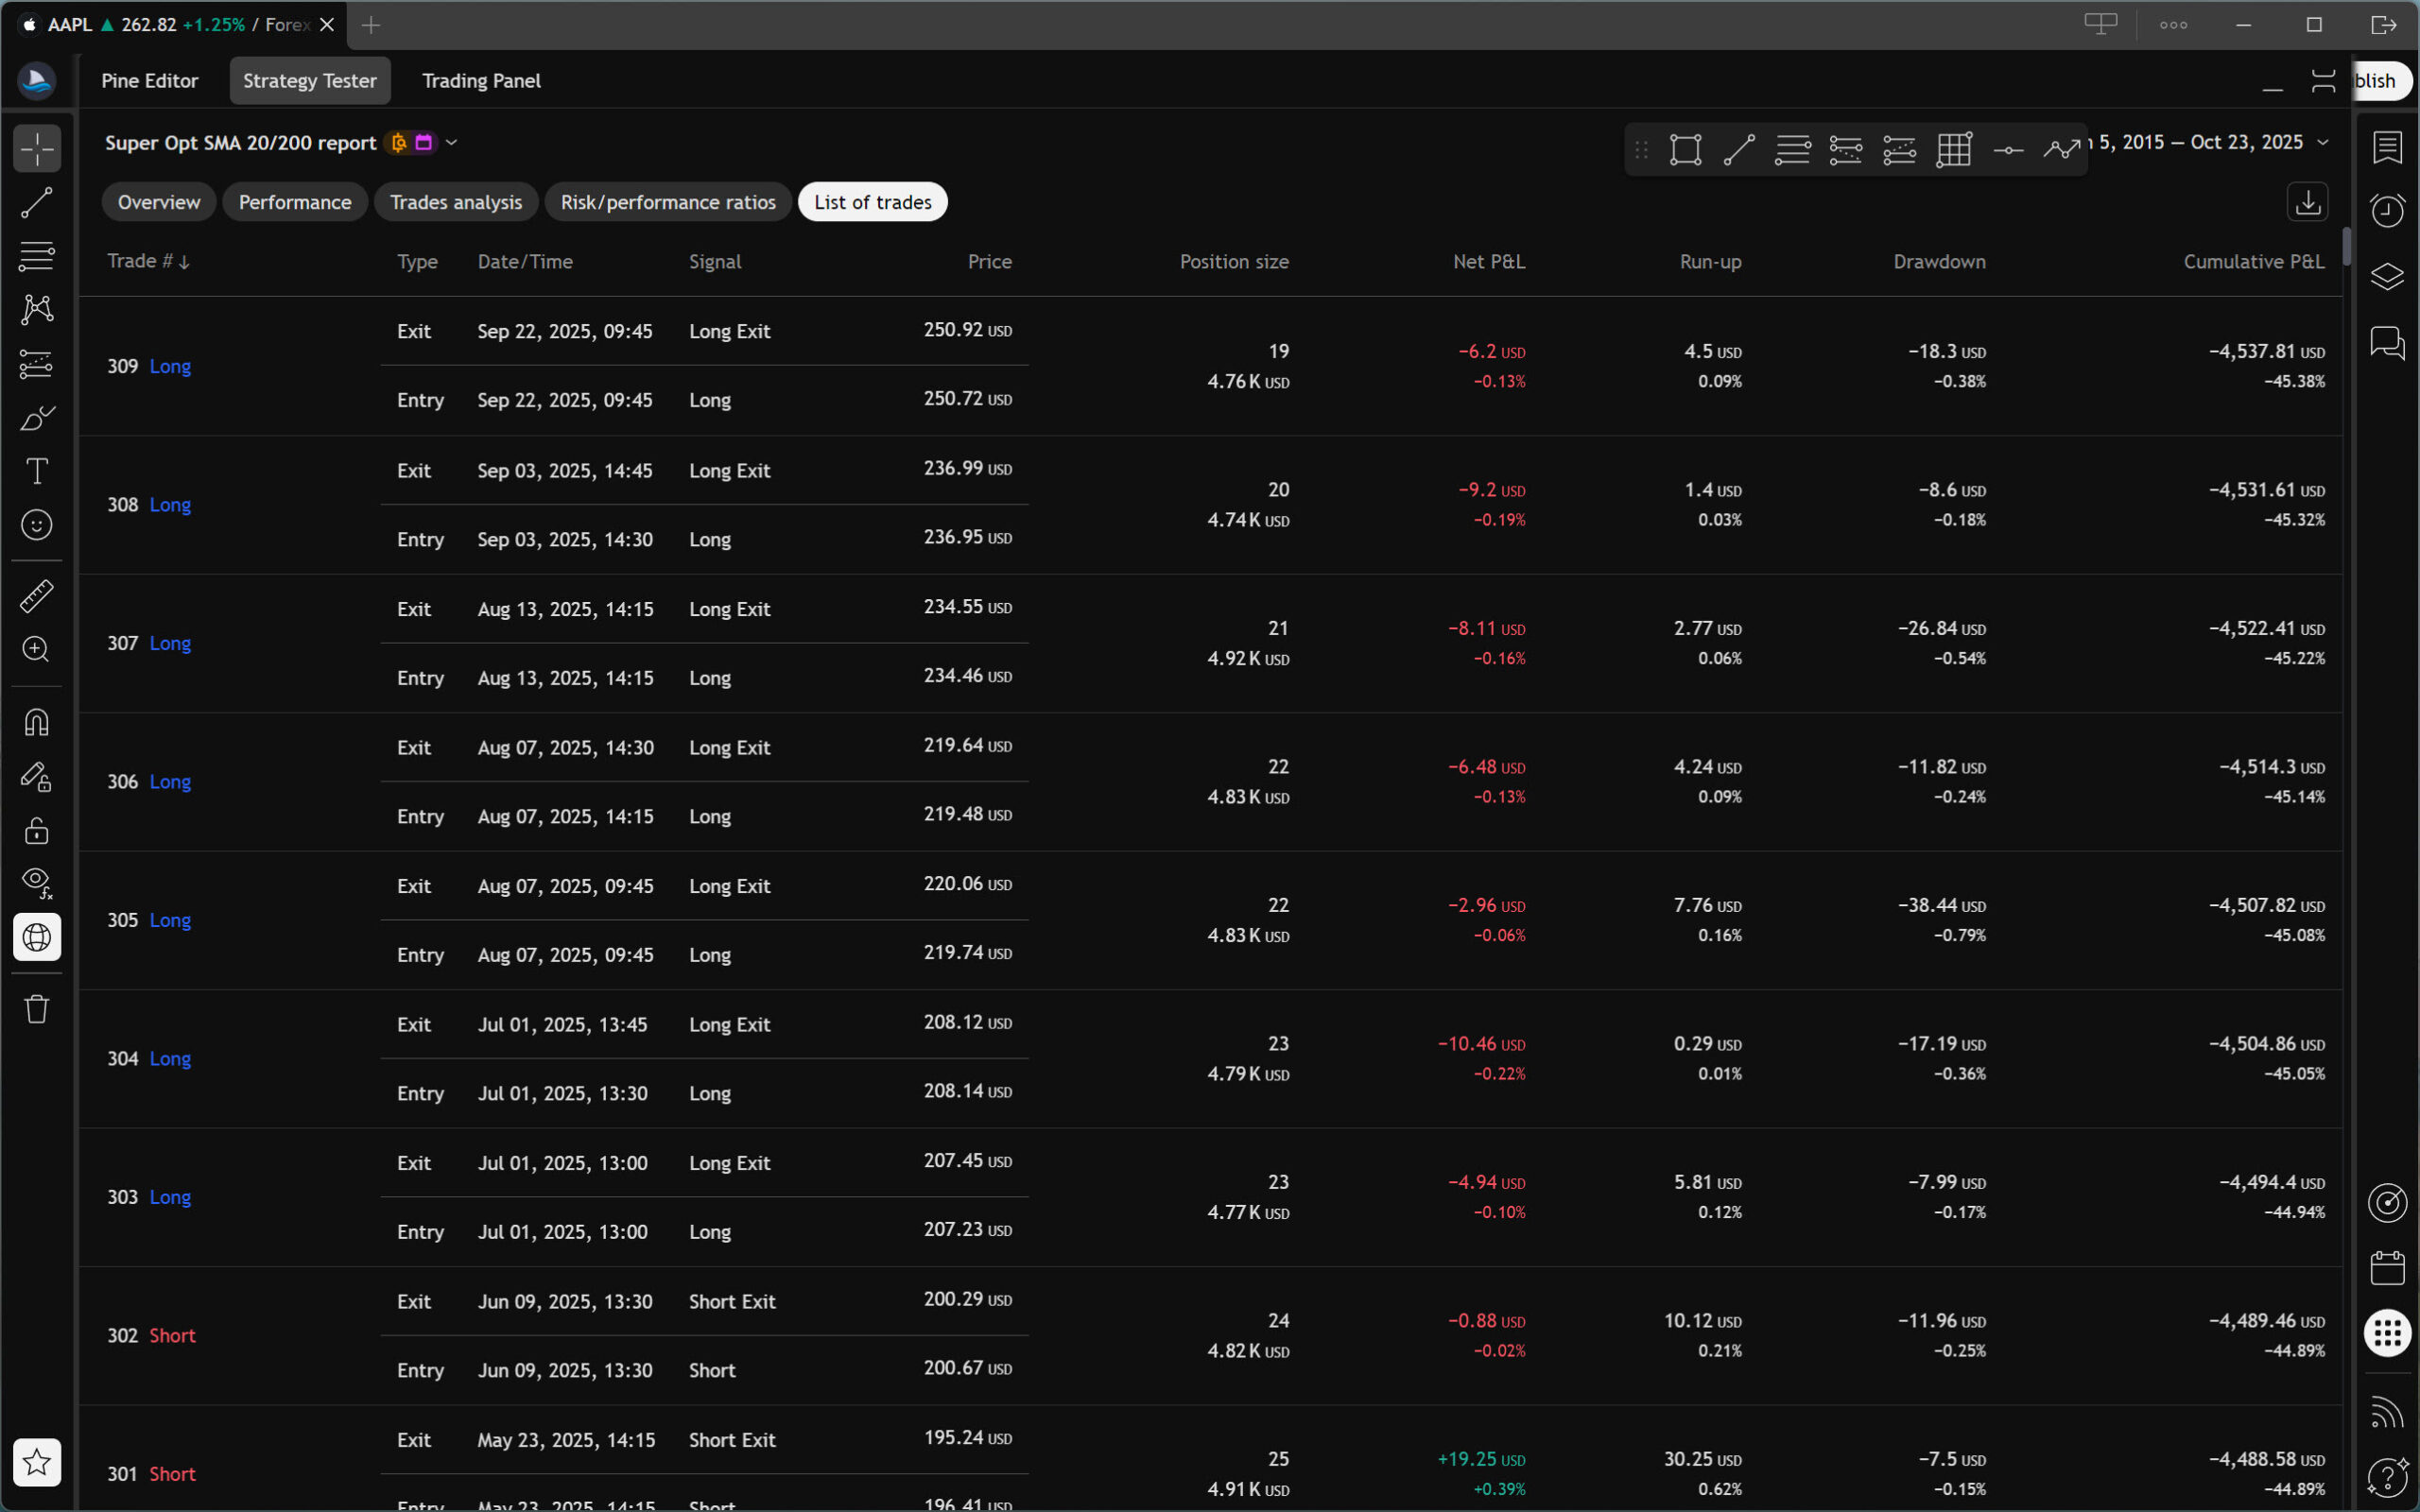
  • The metrics are only basic. There is no detailed graphical representation of the results.
  • Backtest results cannot be filtered according to various criteria.
  • The backtesting engine cannot optimize strategy parameters.
  • There is no way to backtest your own historical data.

Despite several shortcomings, Strategy Tester is a usable backtesting solution. If you want to test simple strategies, such as those that work only with OHLC prices, this tool will suffice.

Frequently Asked Questions

What are the best alternatives to TradingView in terms of backtesting?

The best alternative to TradingView for manual backtesting is Sierra Chart. It provides users with virtually unlimited possibilities for what and how they can test.

However, if you are interested in automated backtesting, check out TradeStation or Amibroker. These two trading platforms are leaders in automated trading, and both offer advanced backtesting and optimization tools.

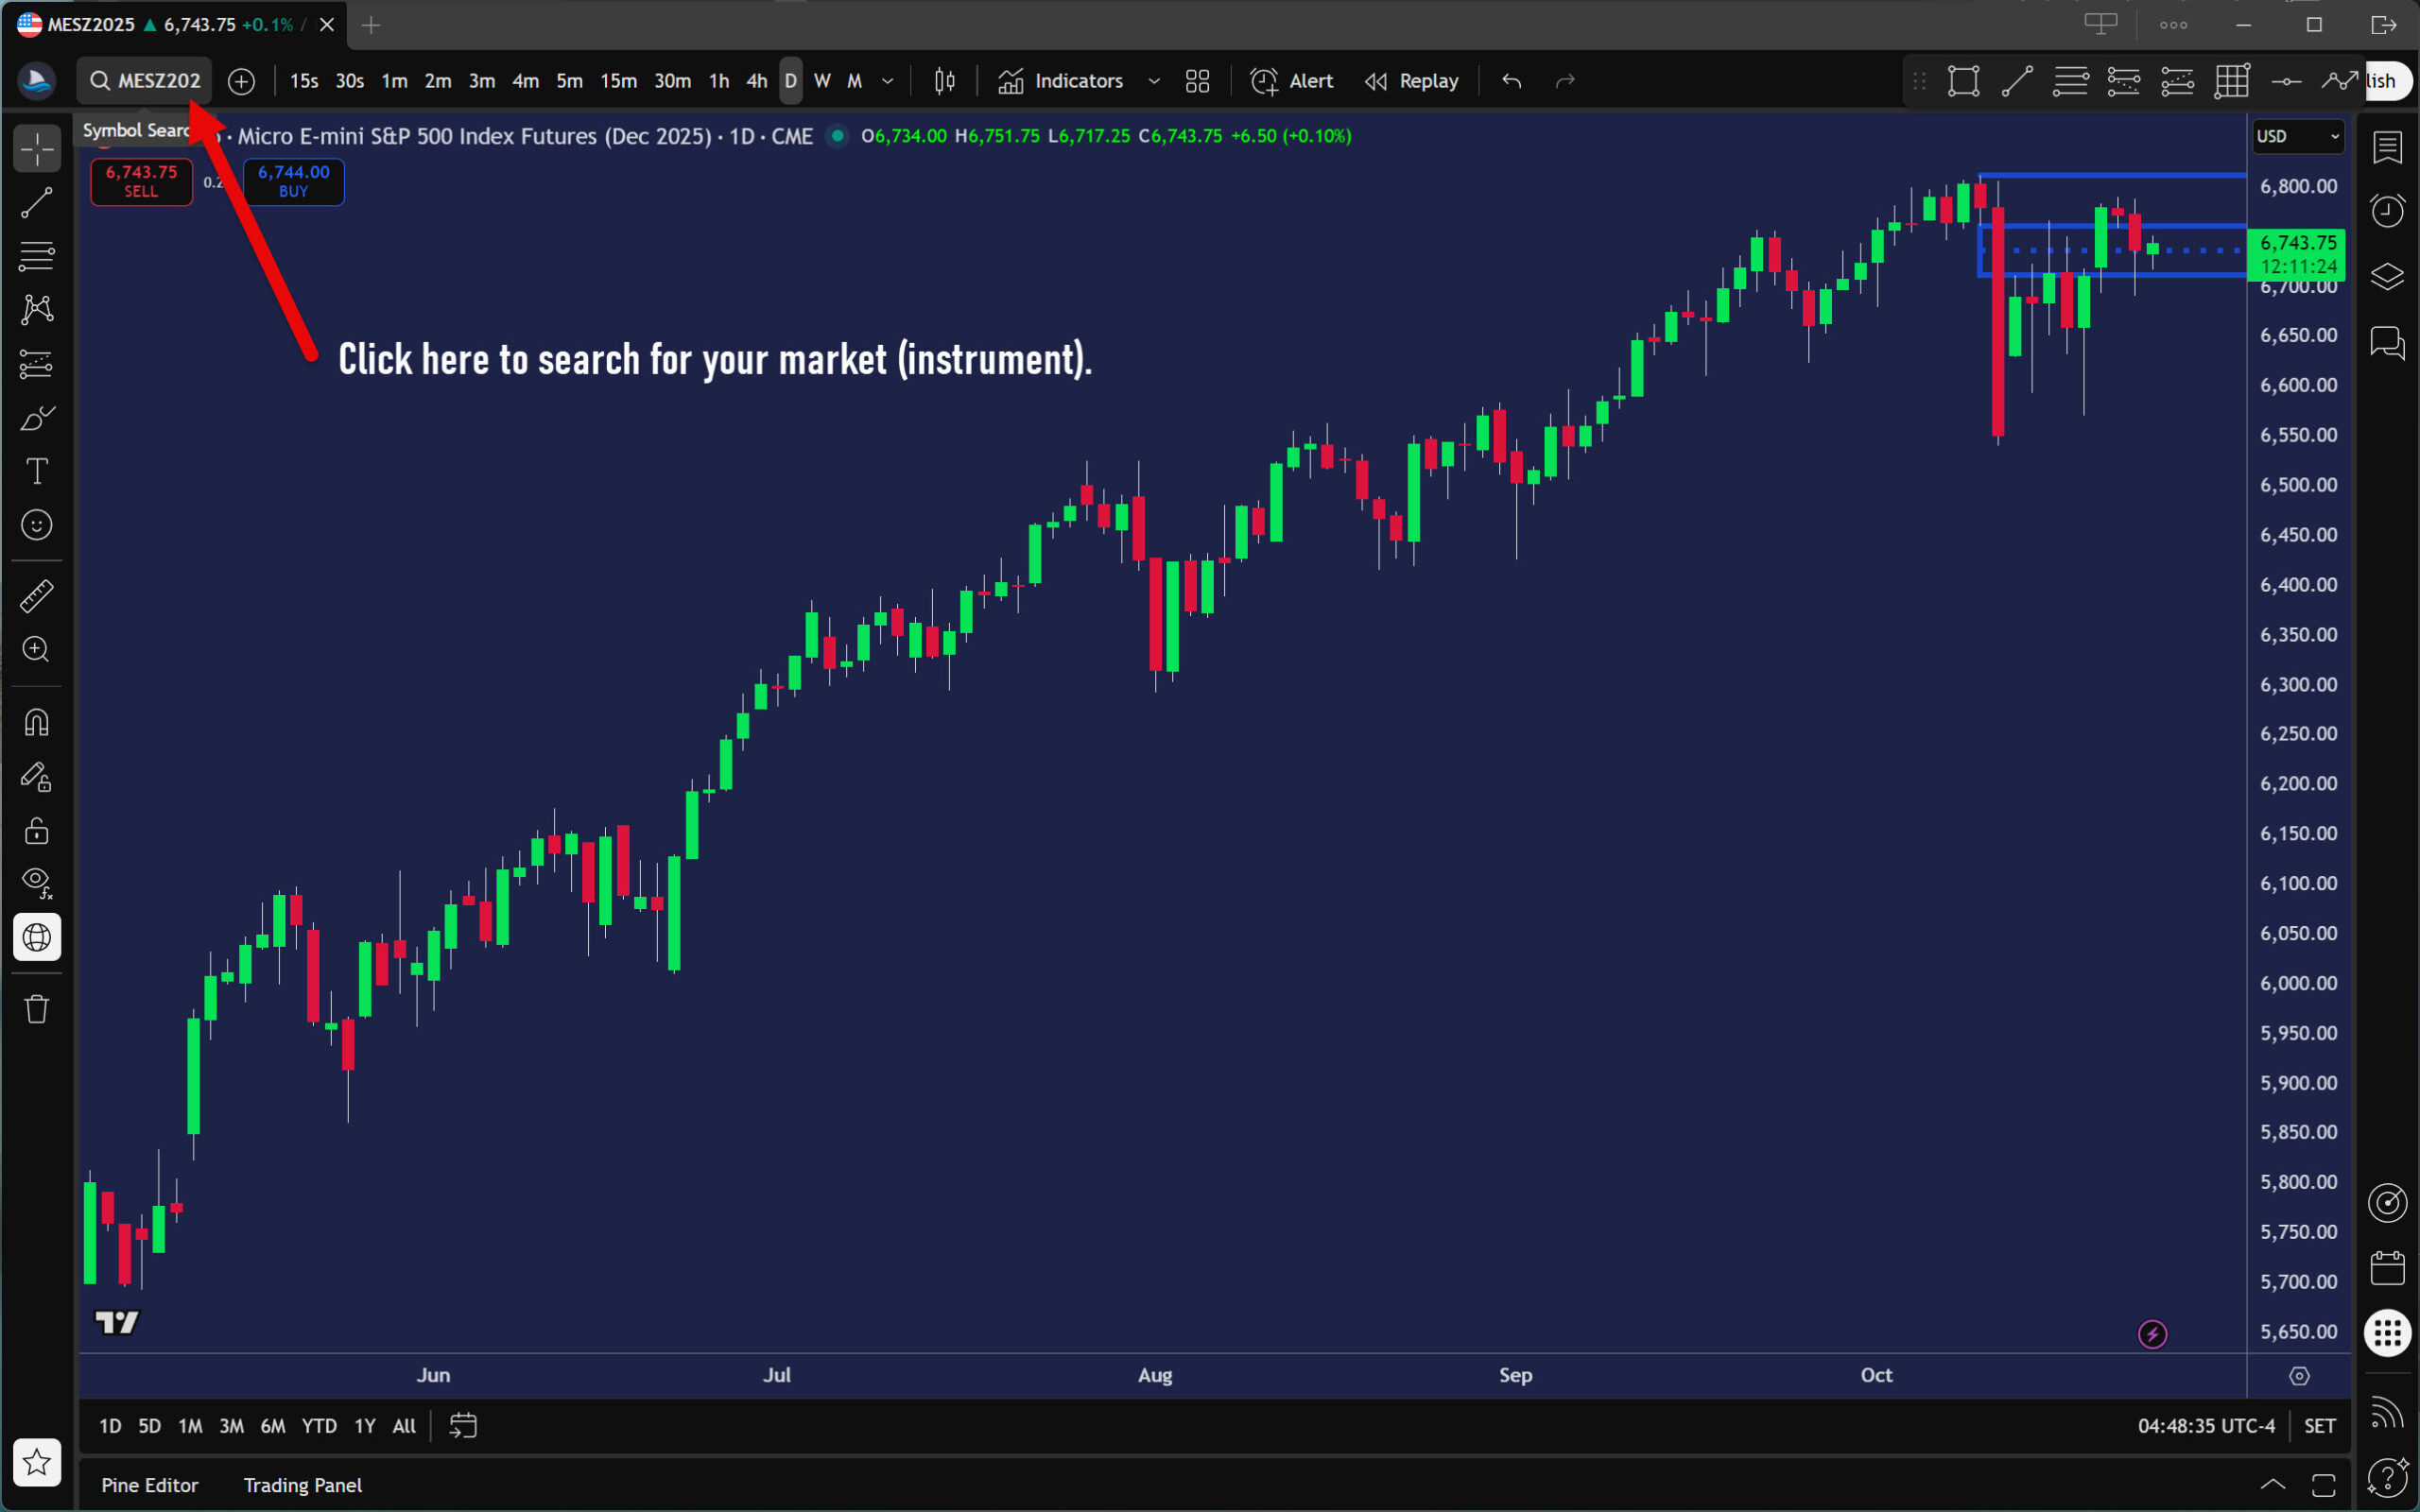
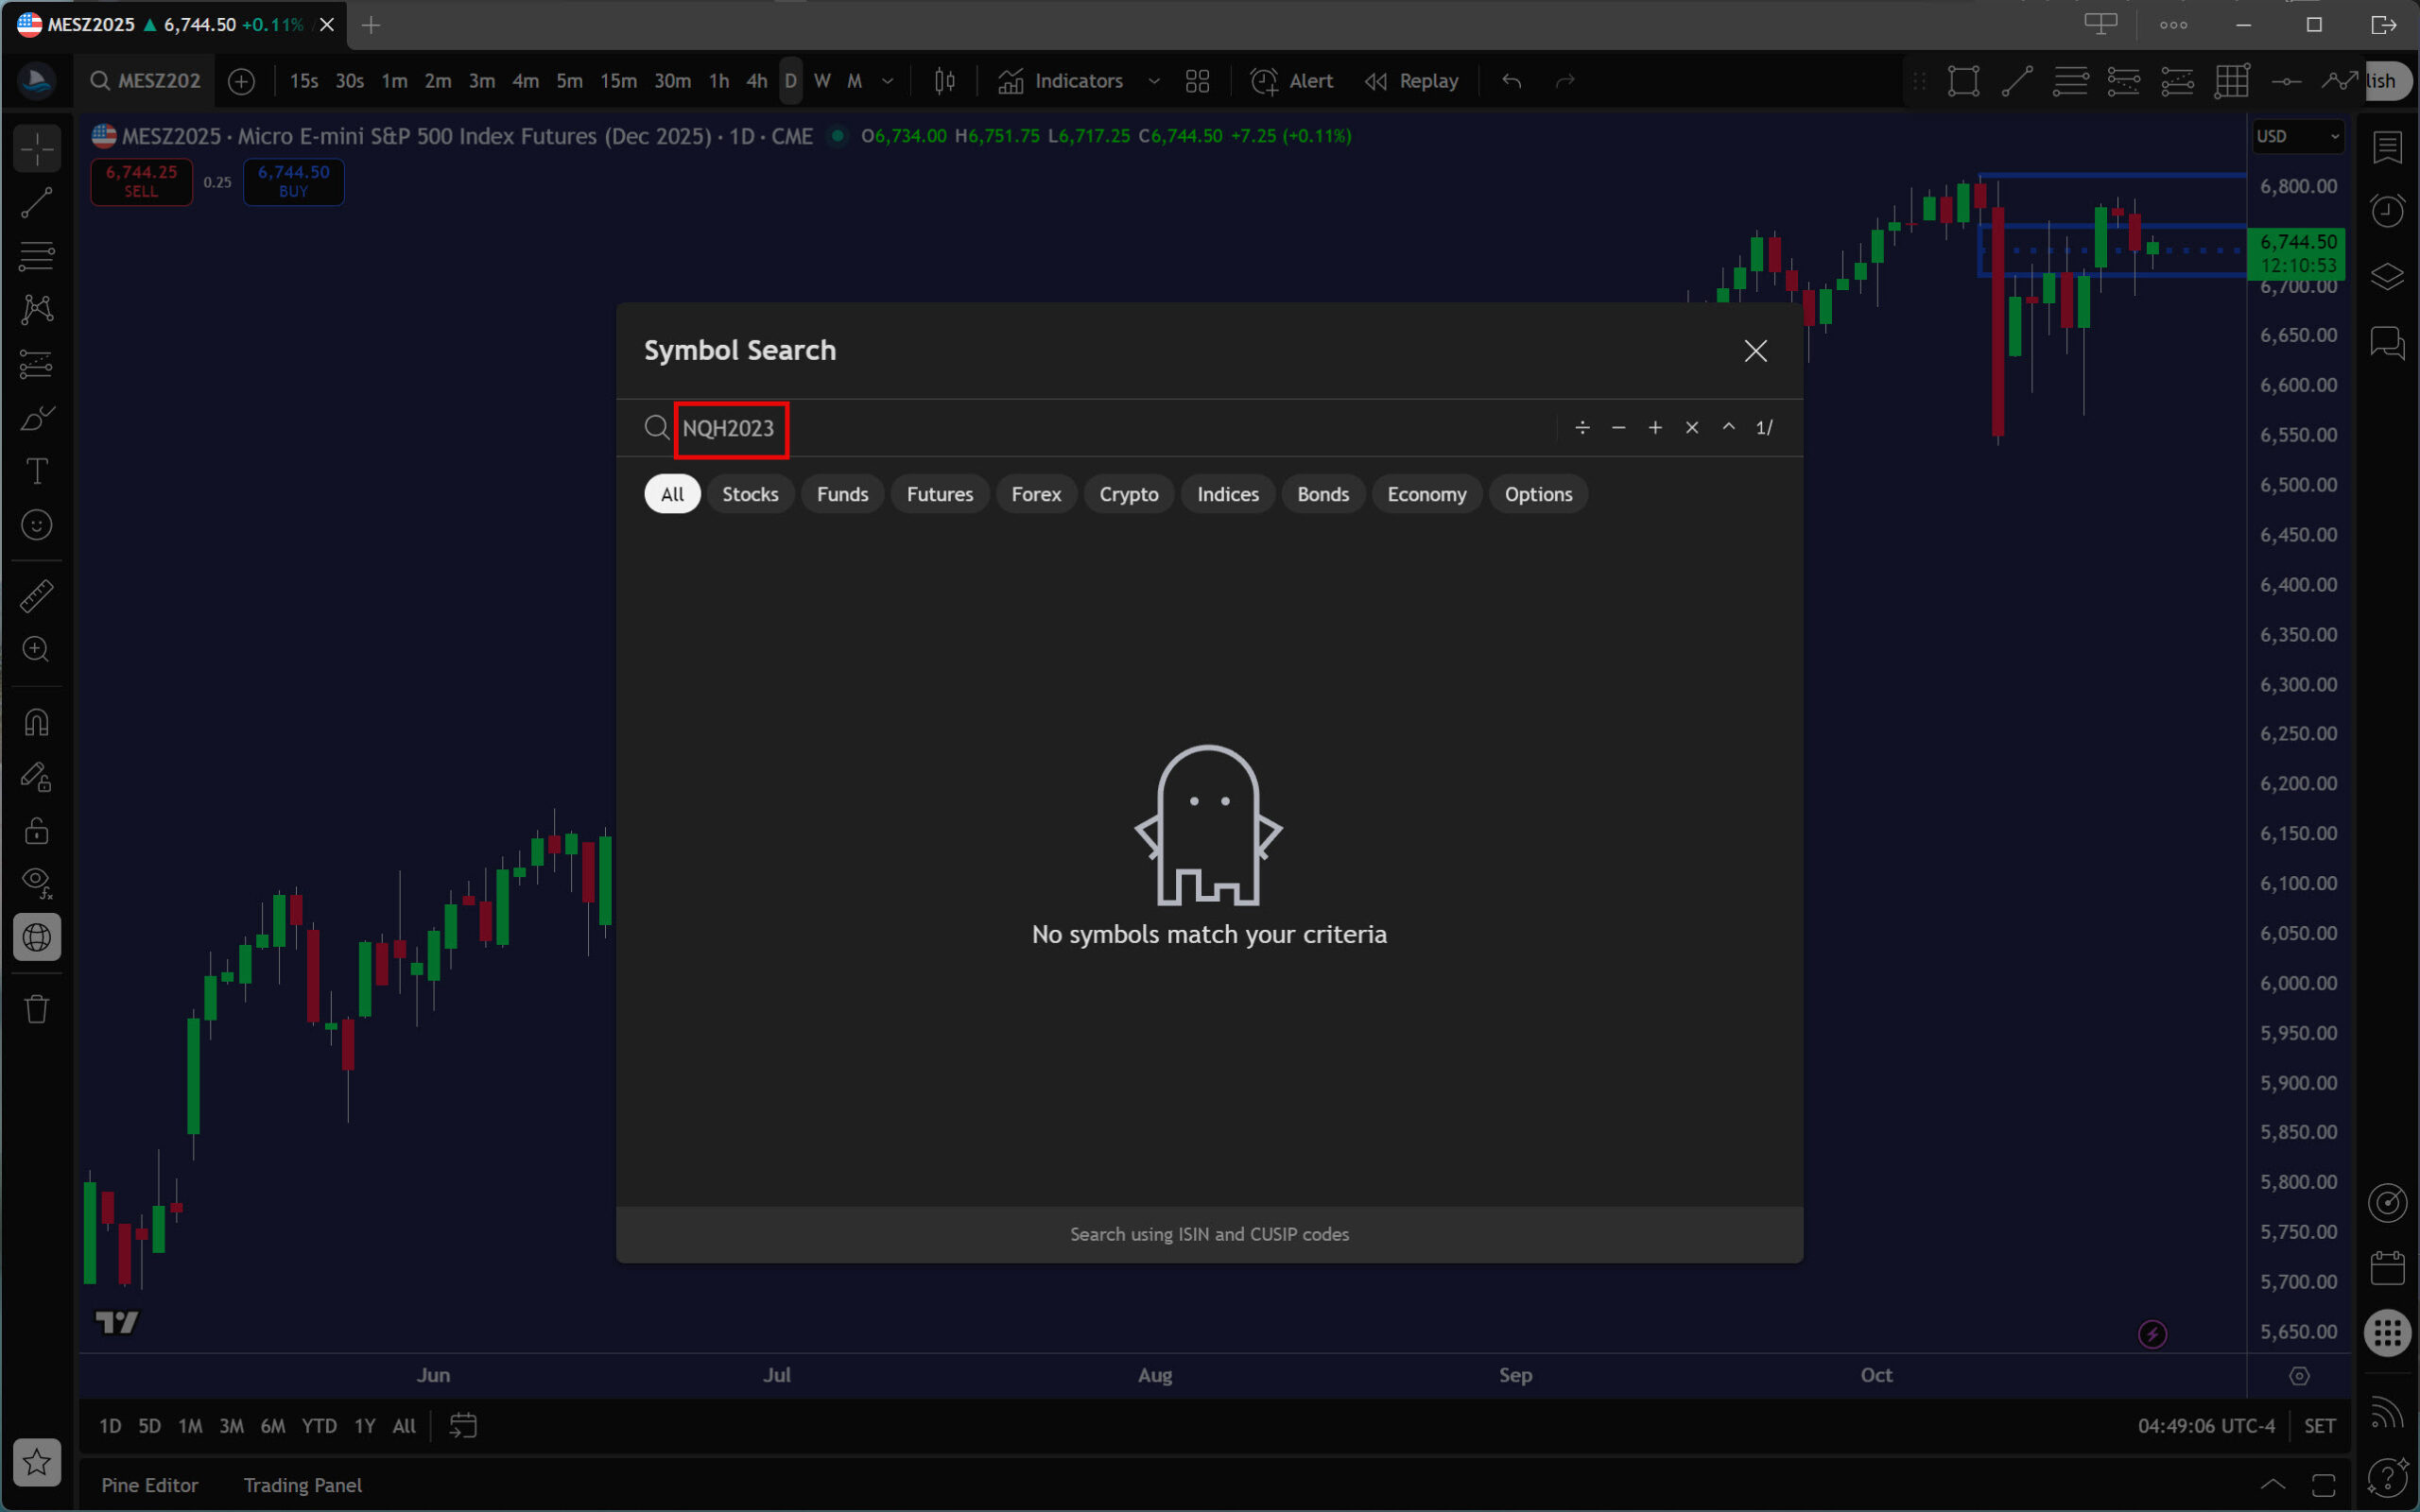
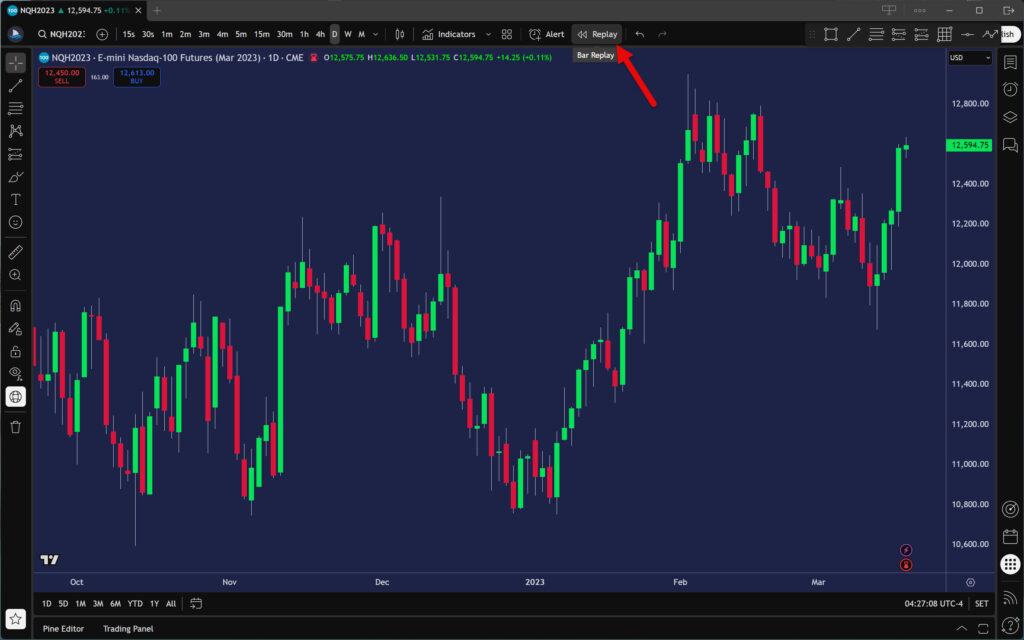
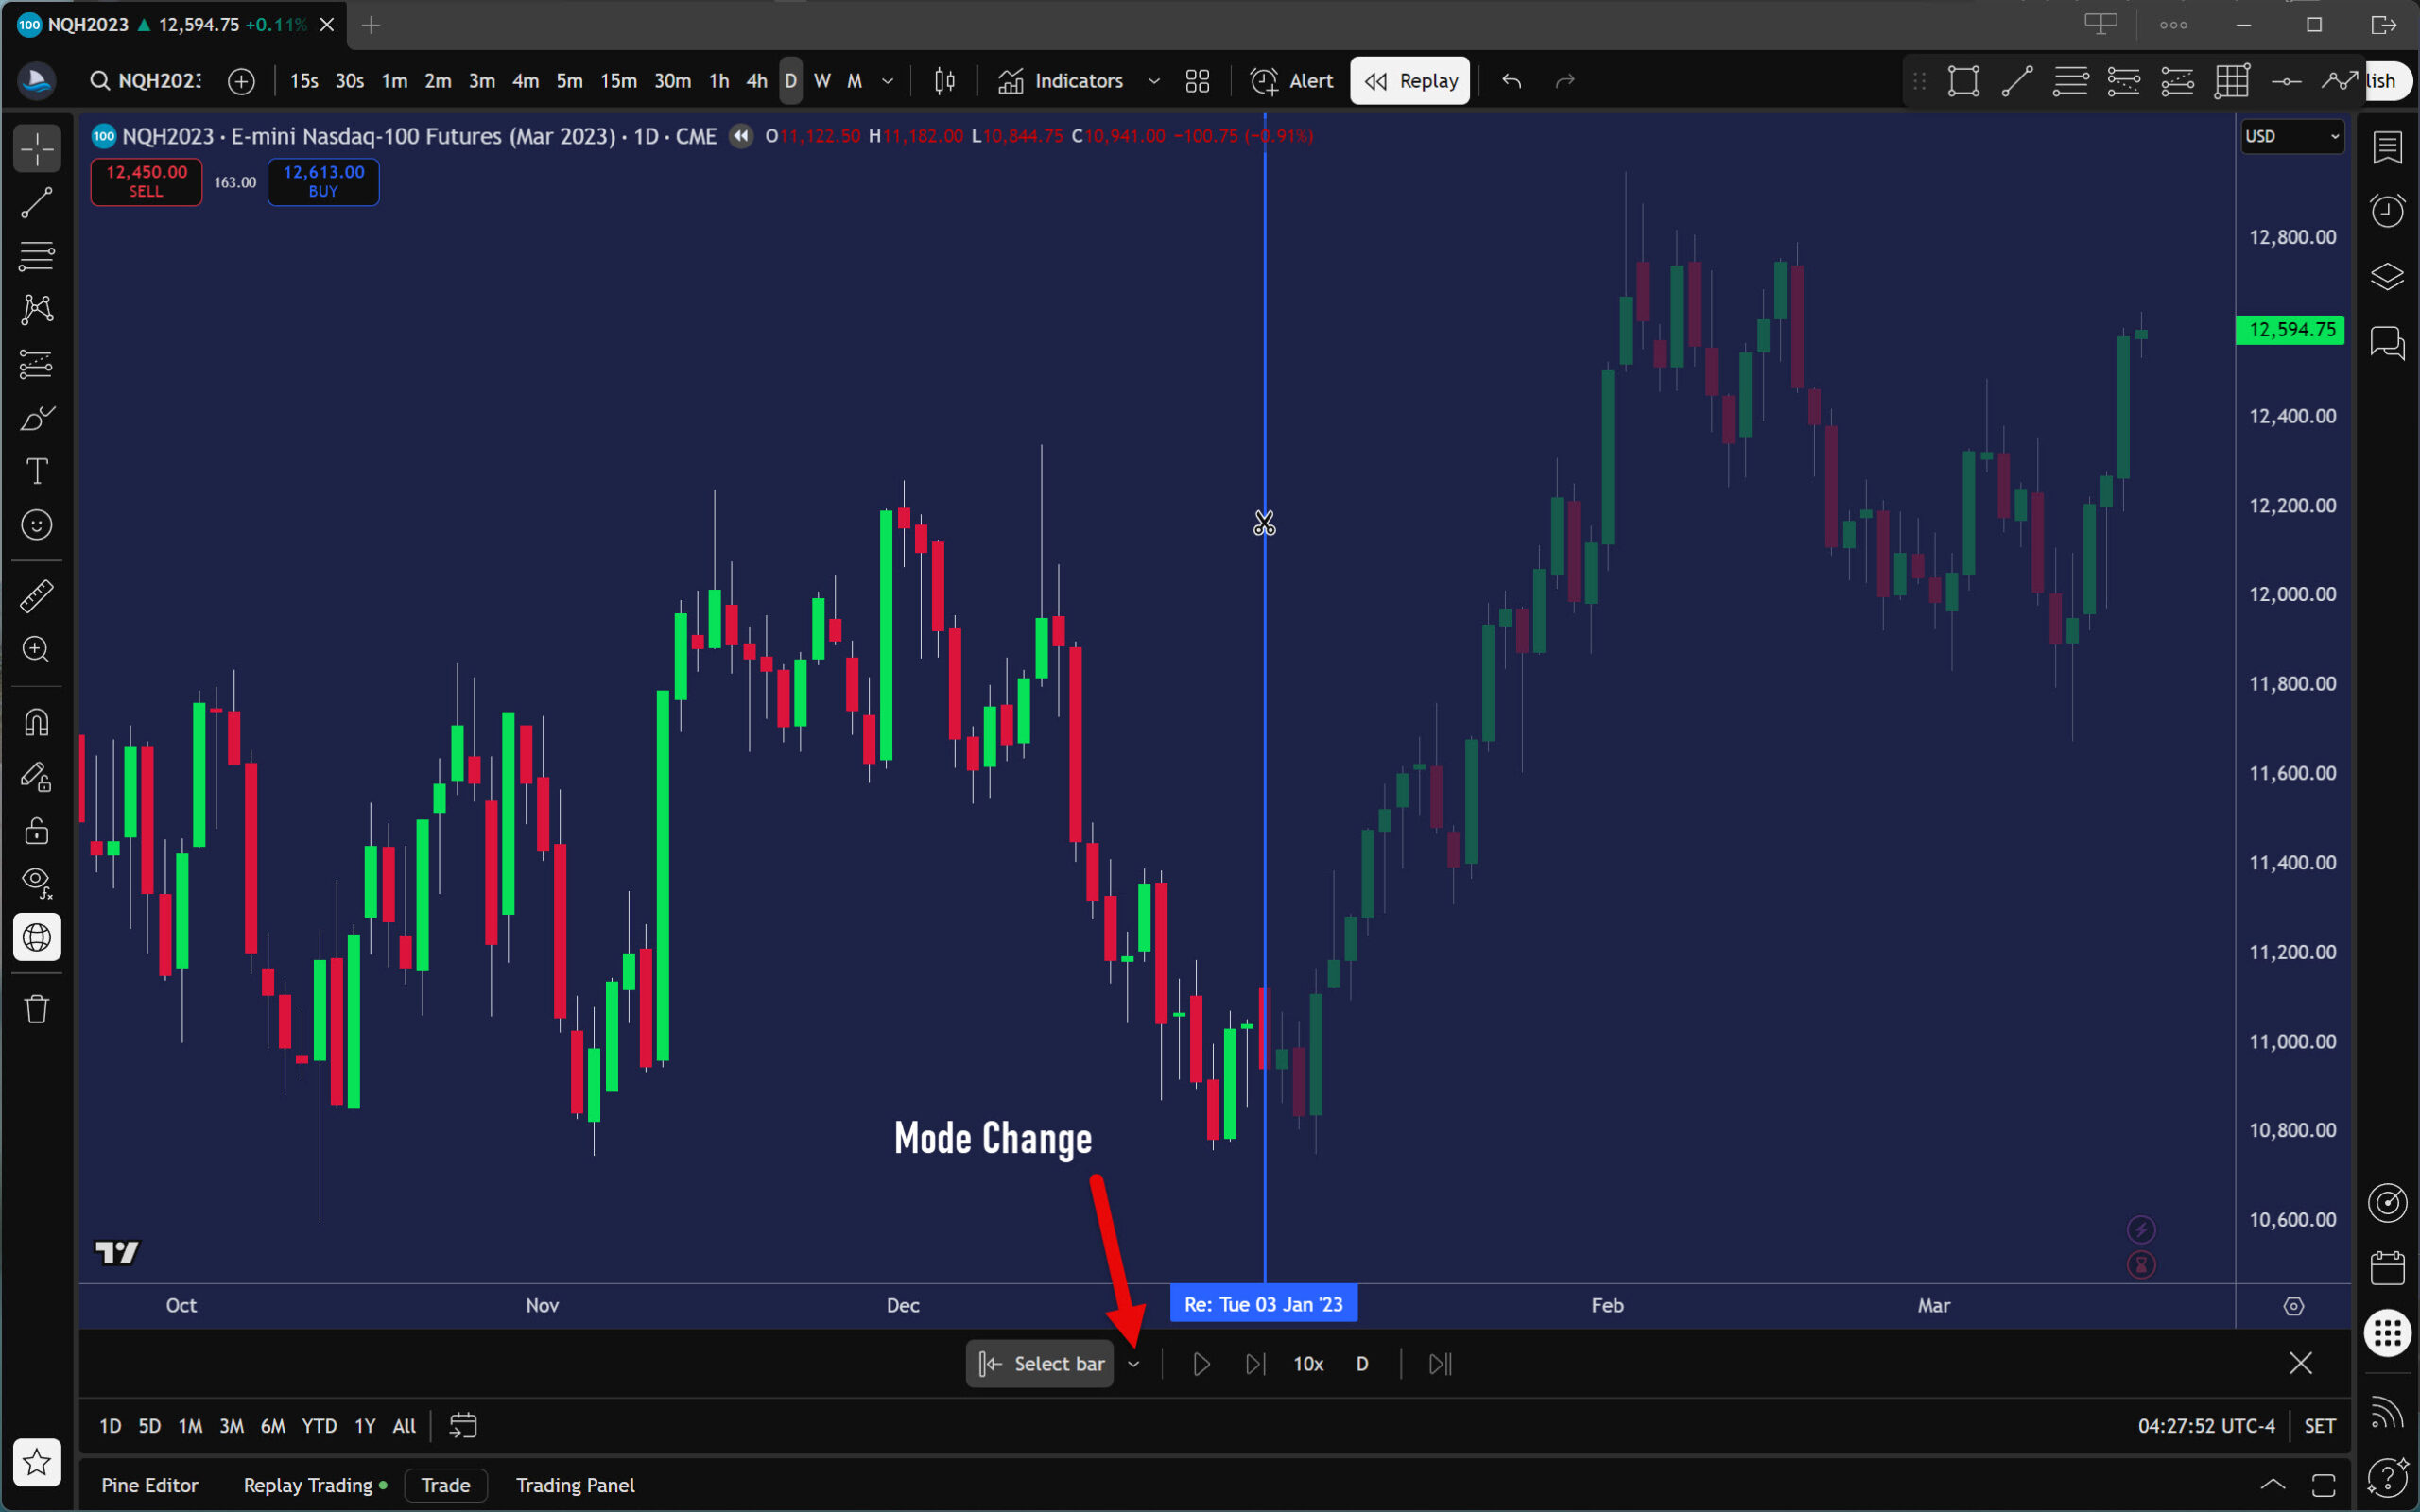
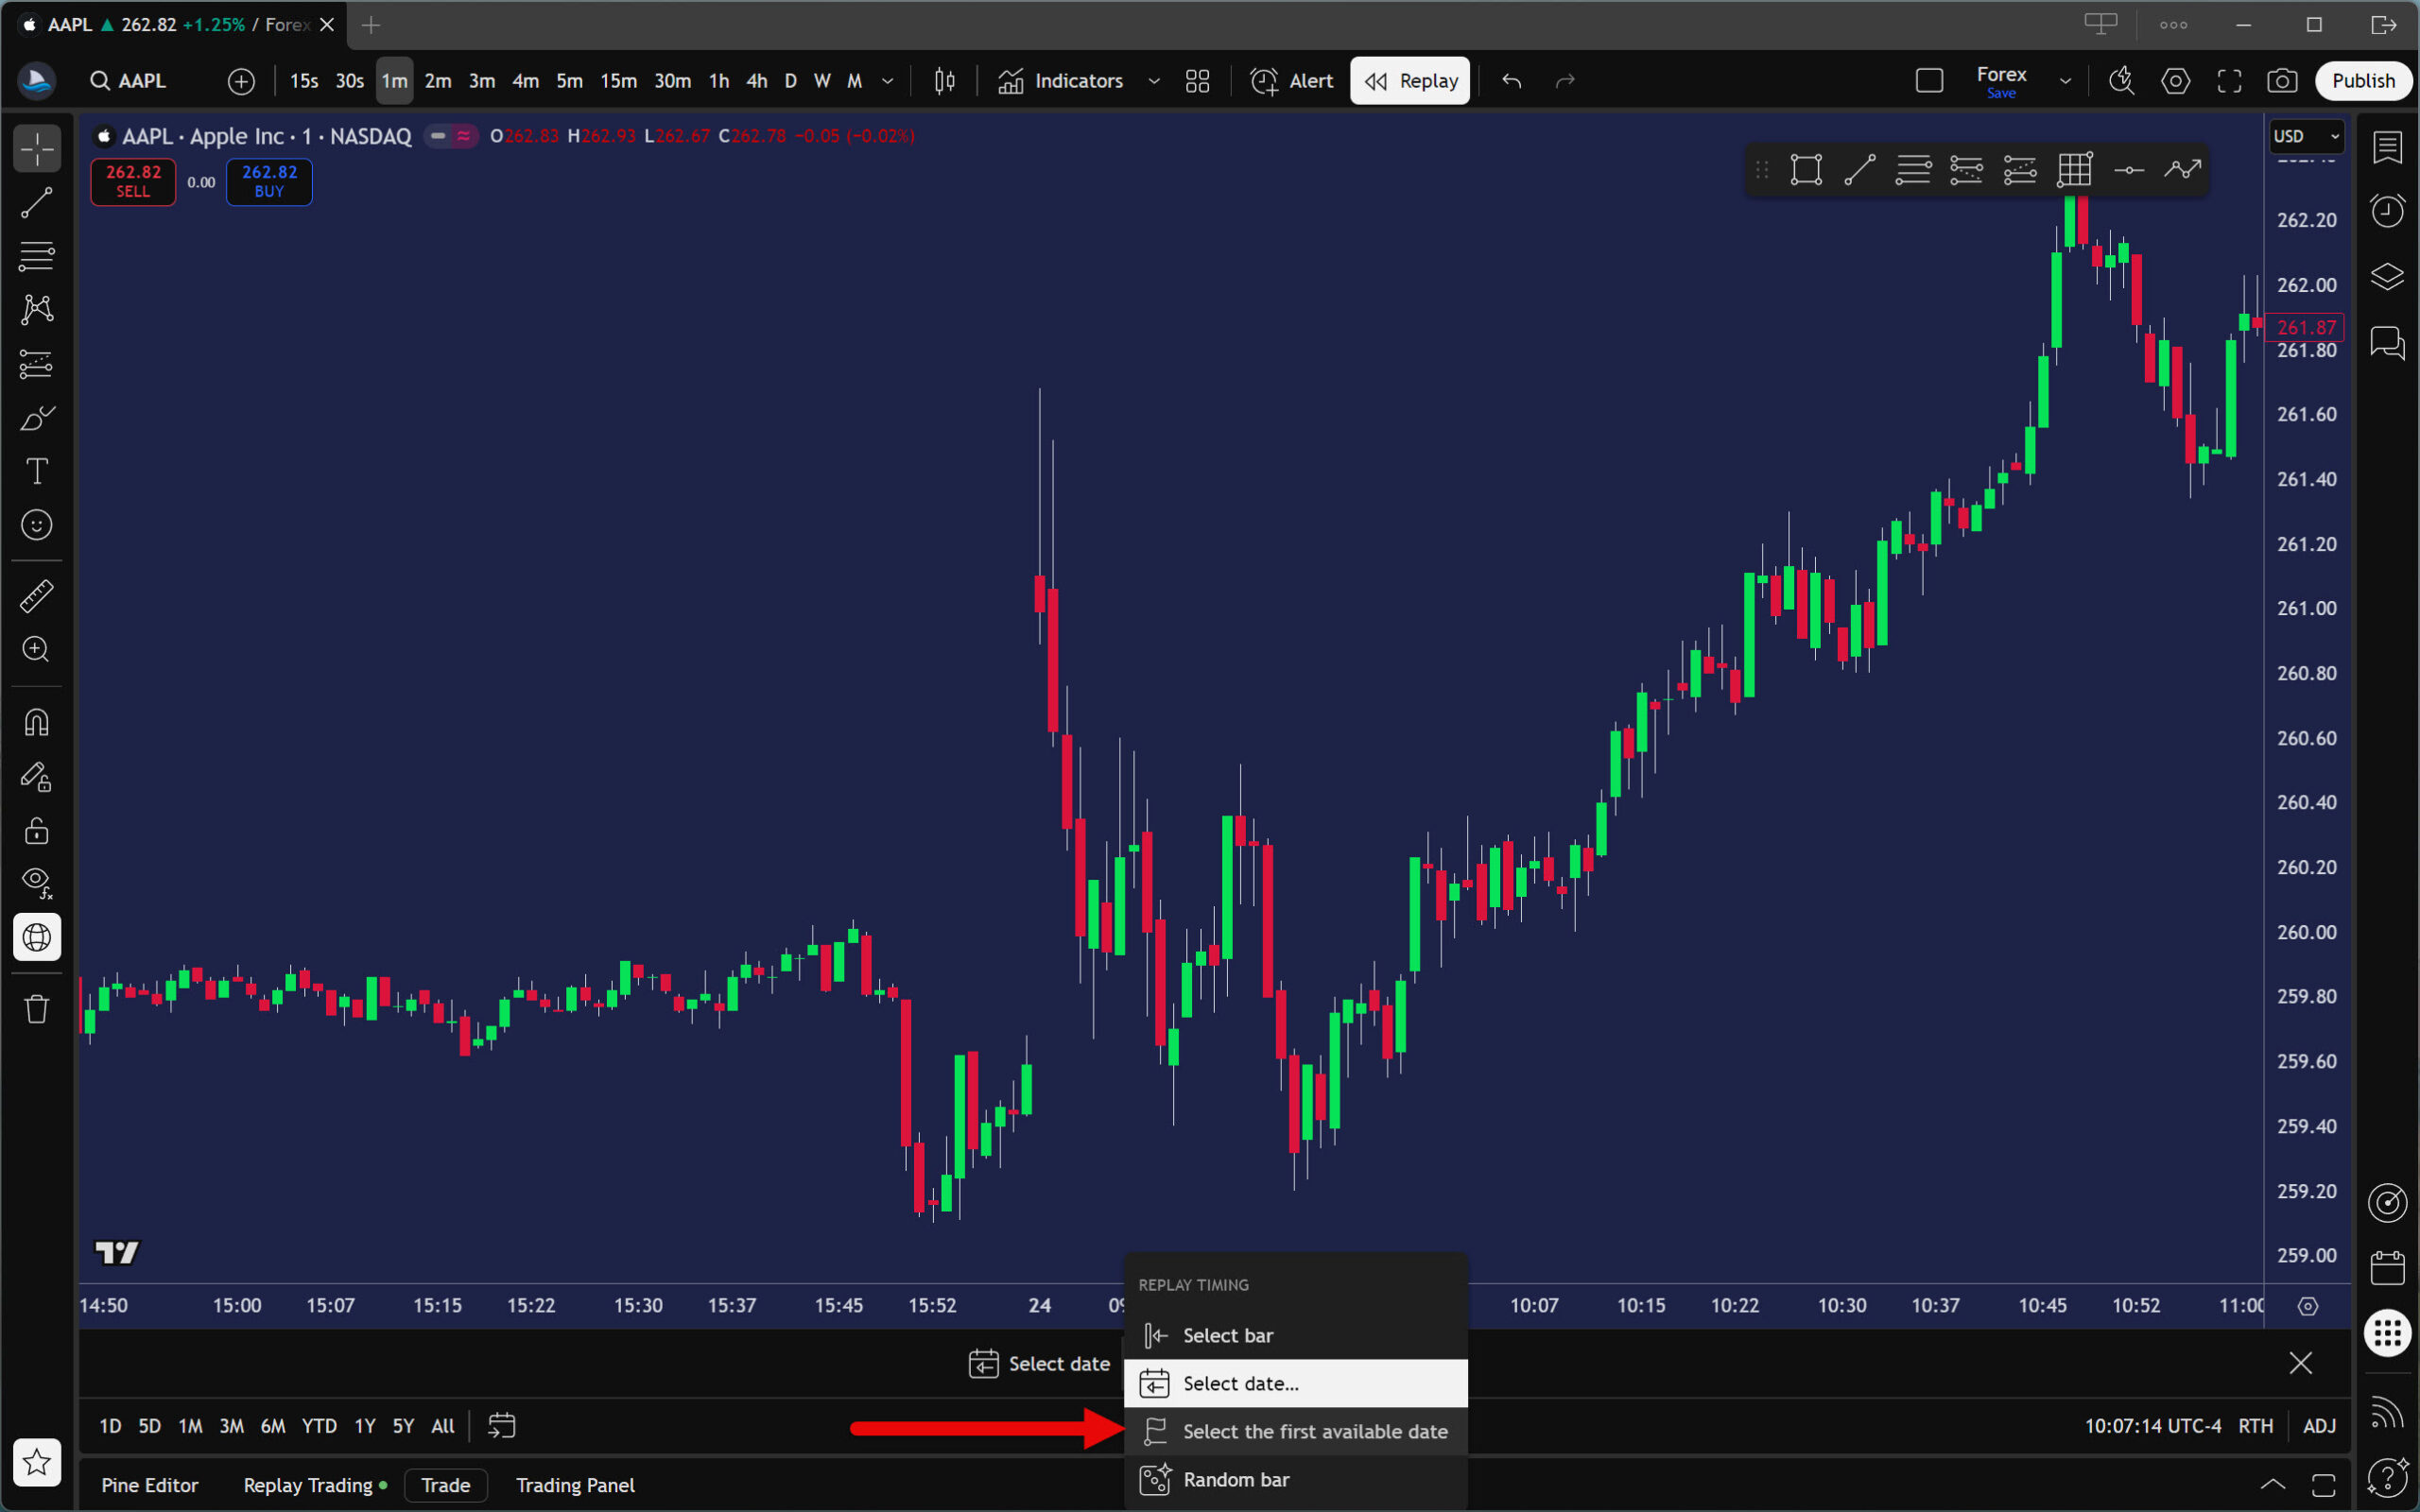
How can I find out how far back the data for a specific instrument goes?

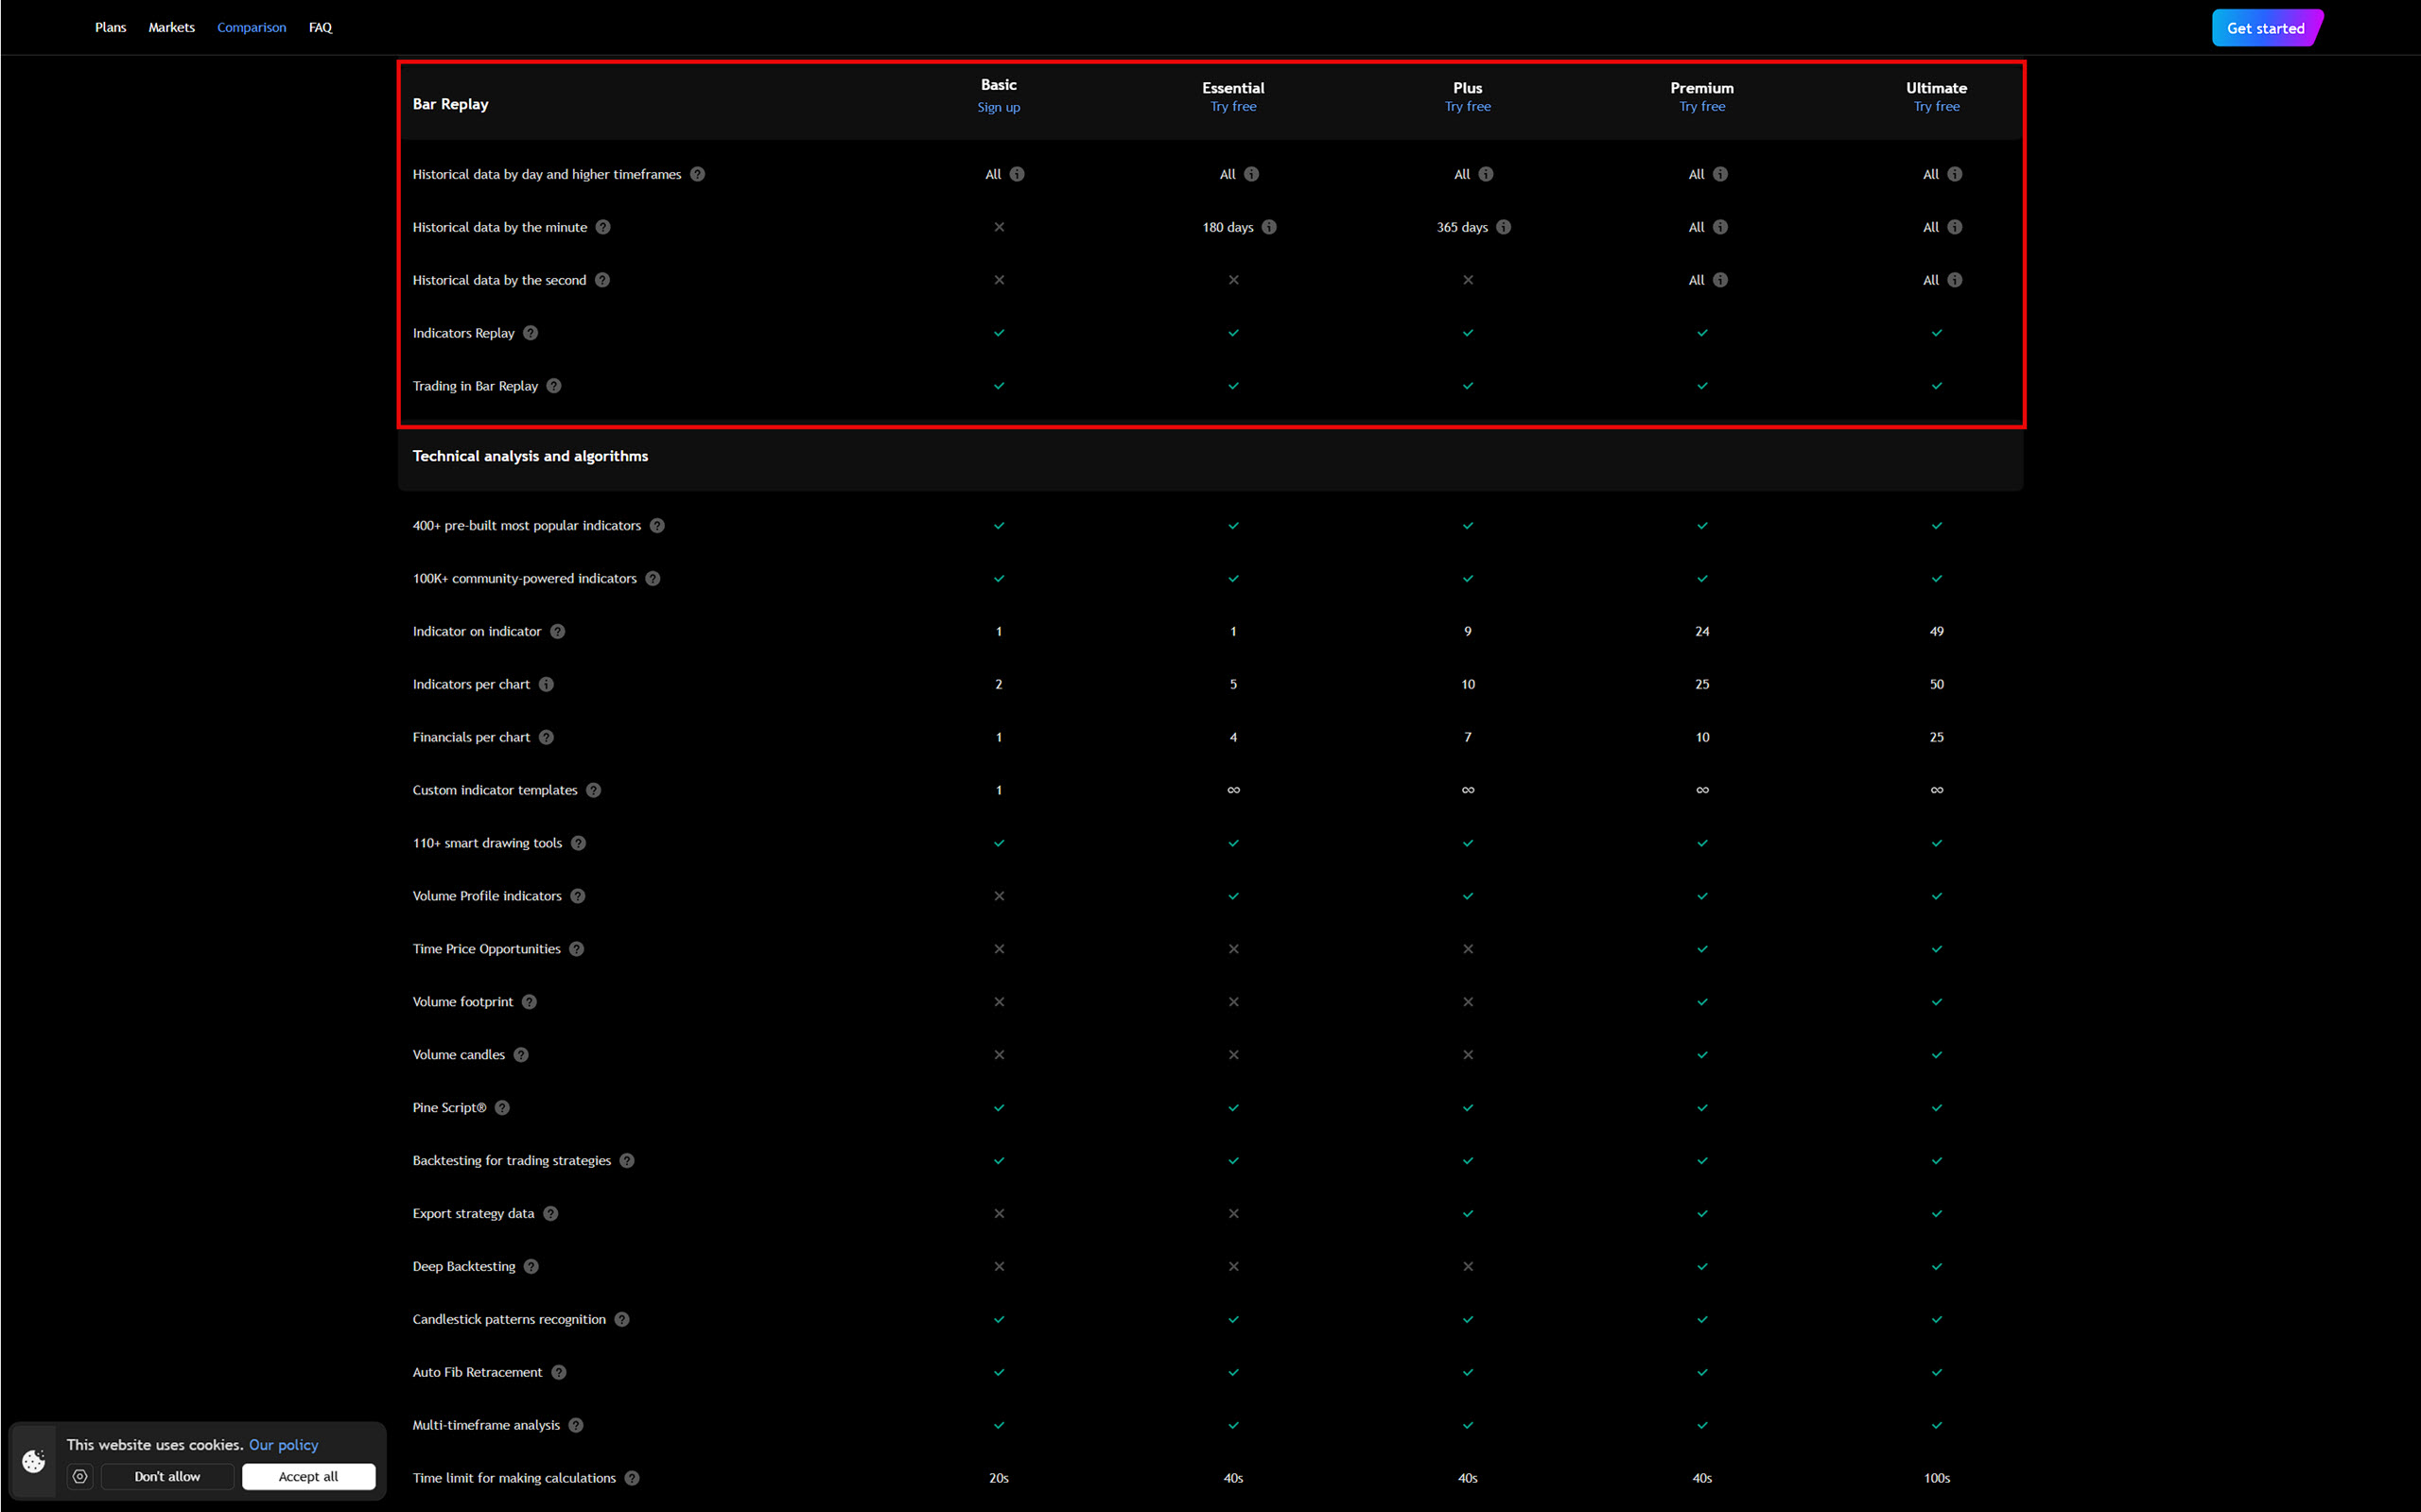
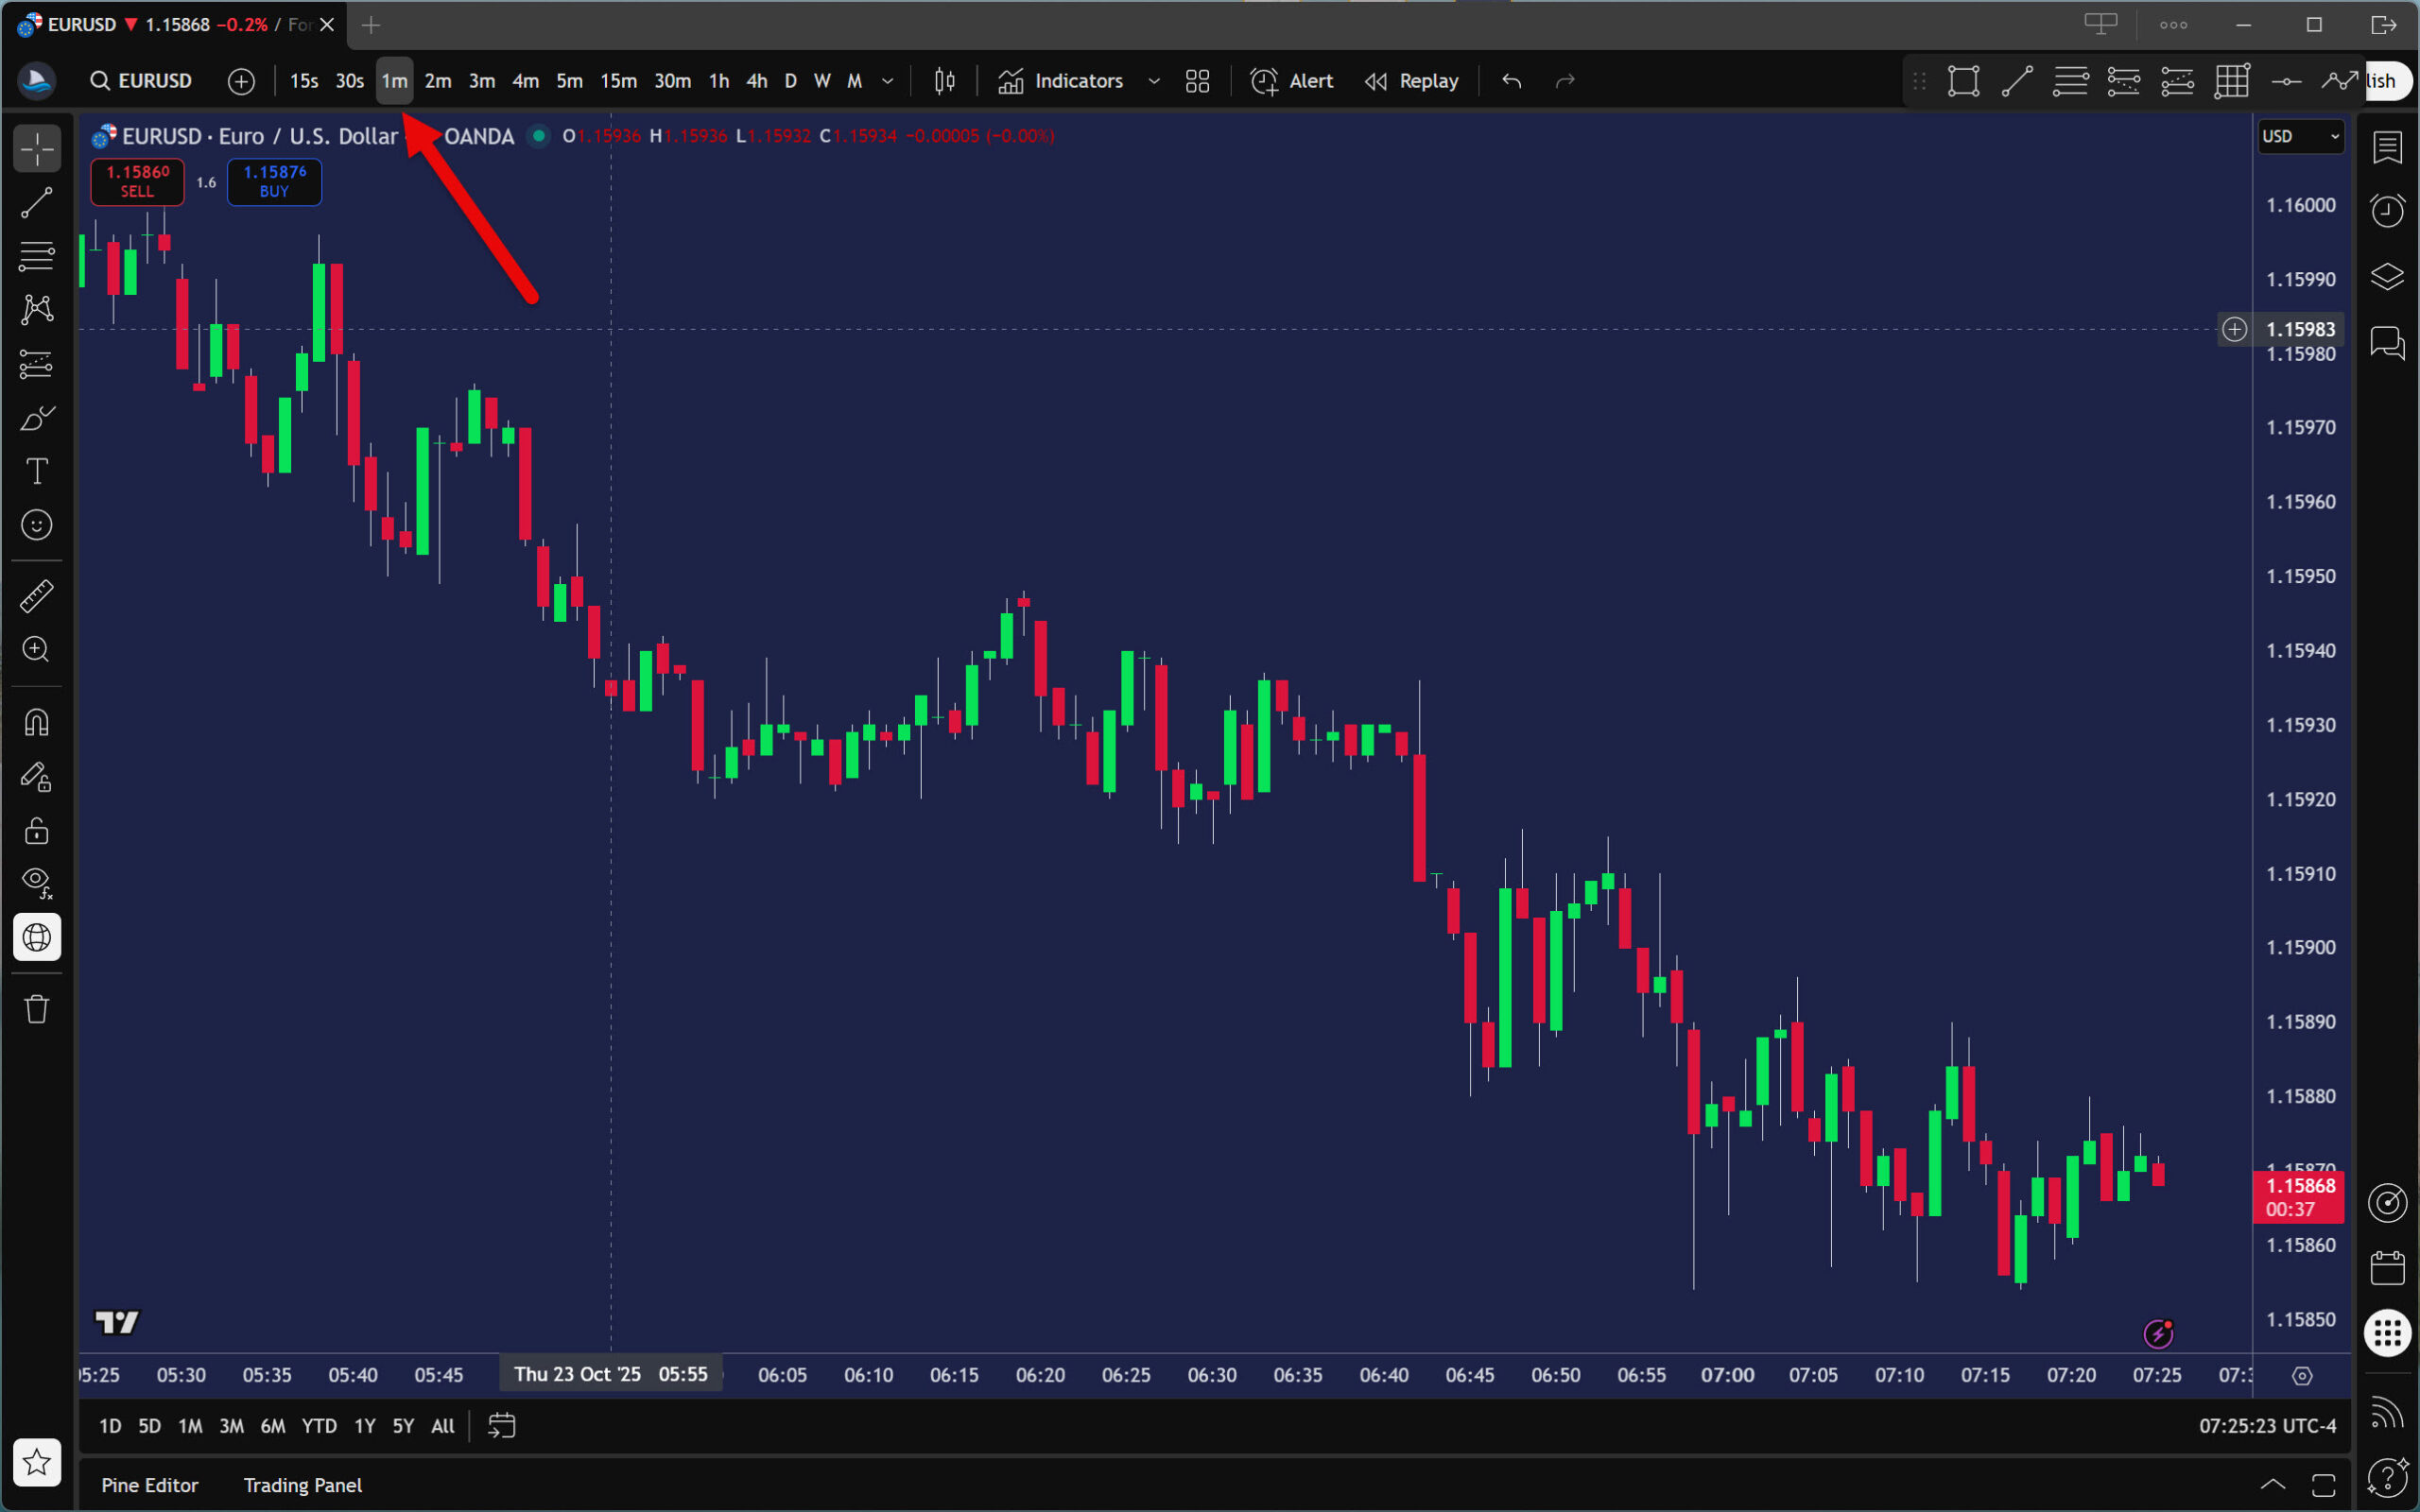
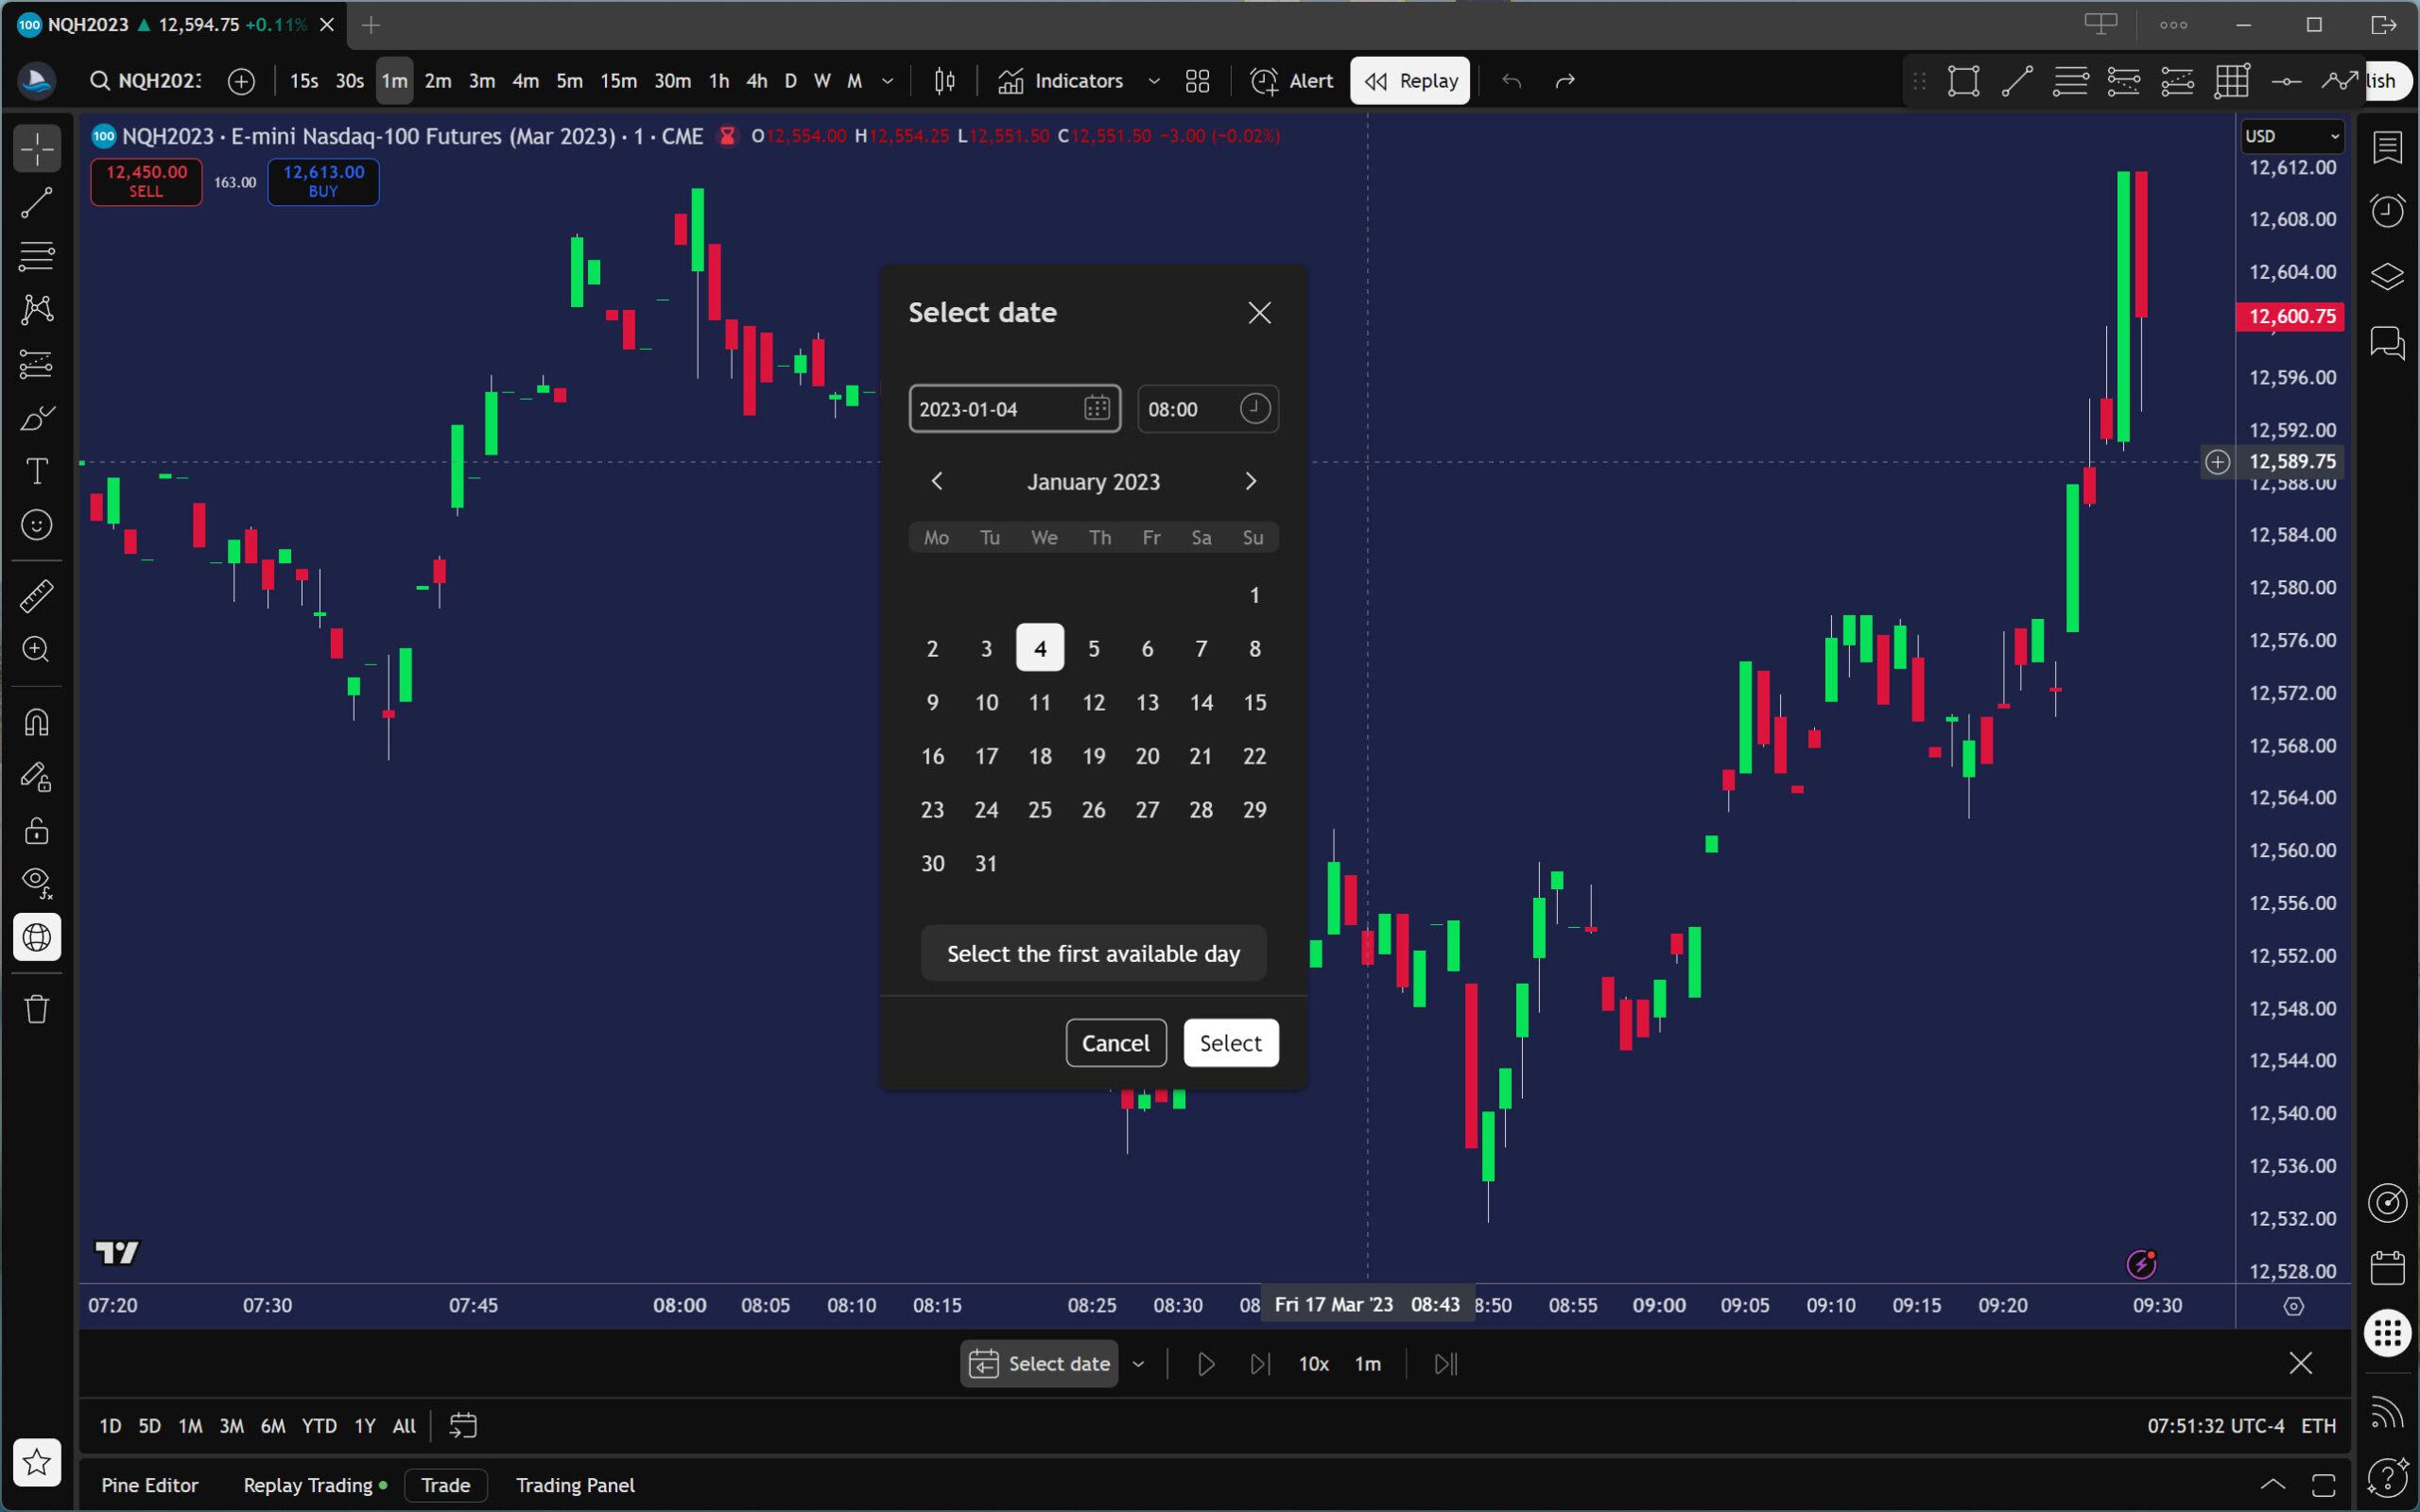
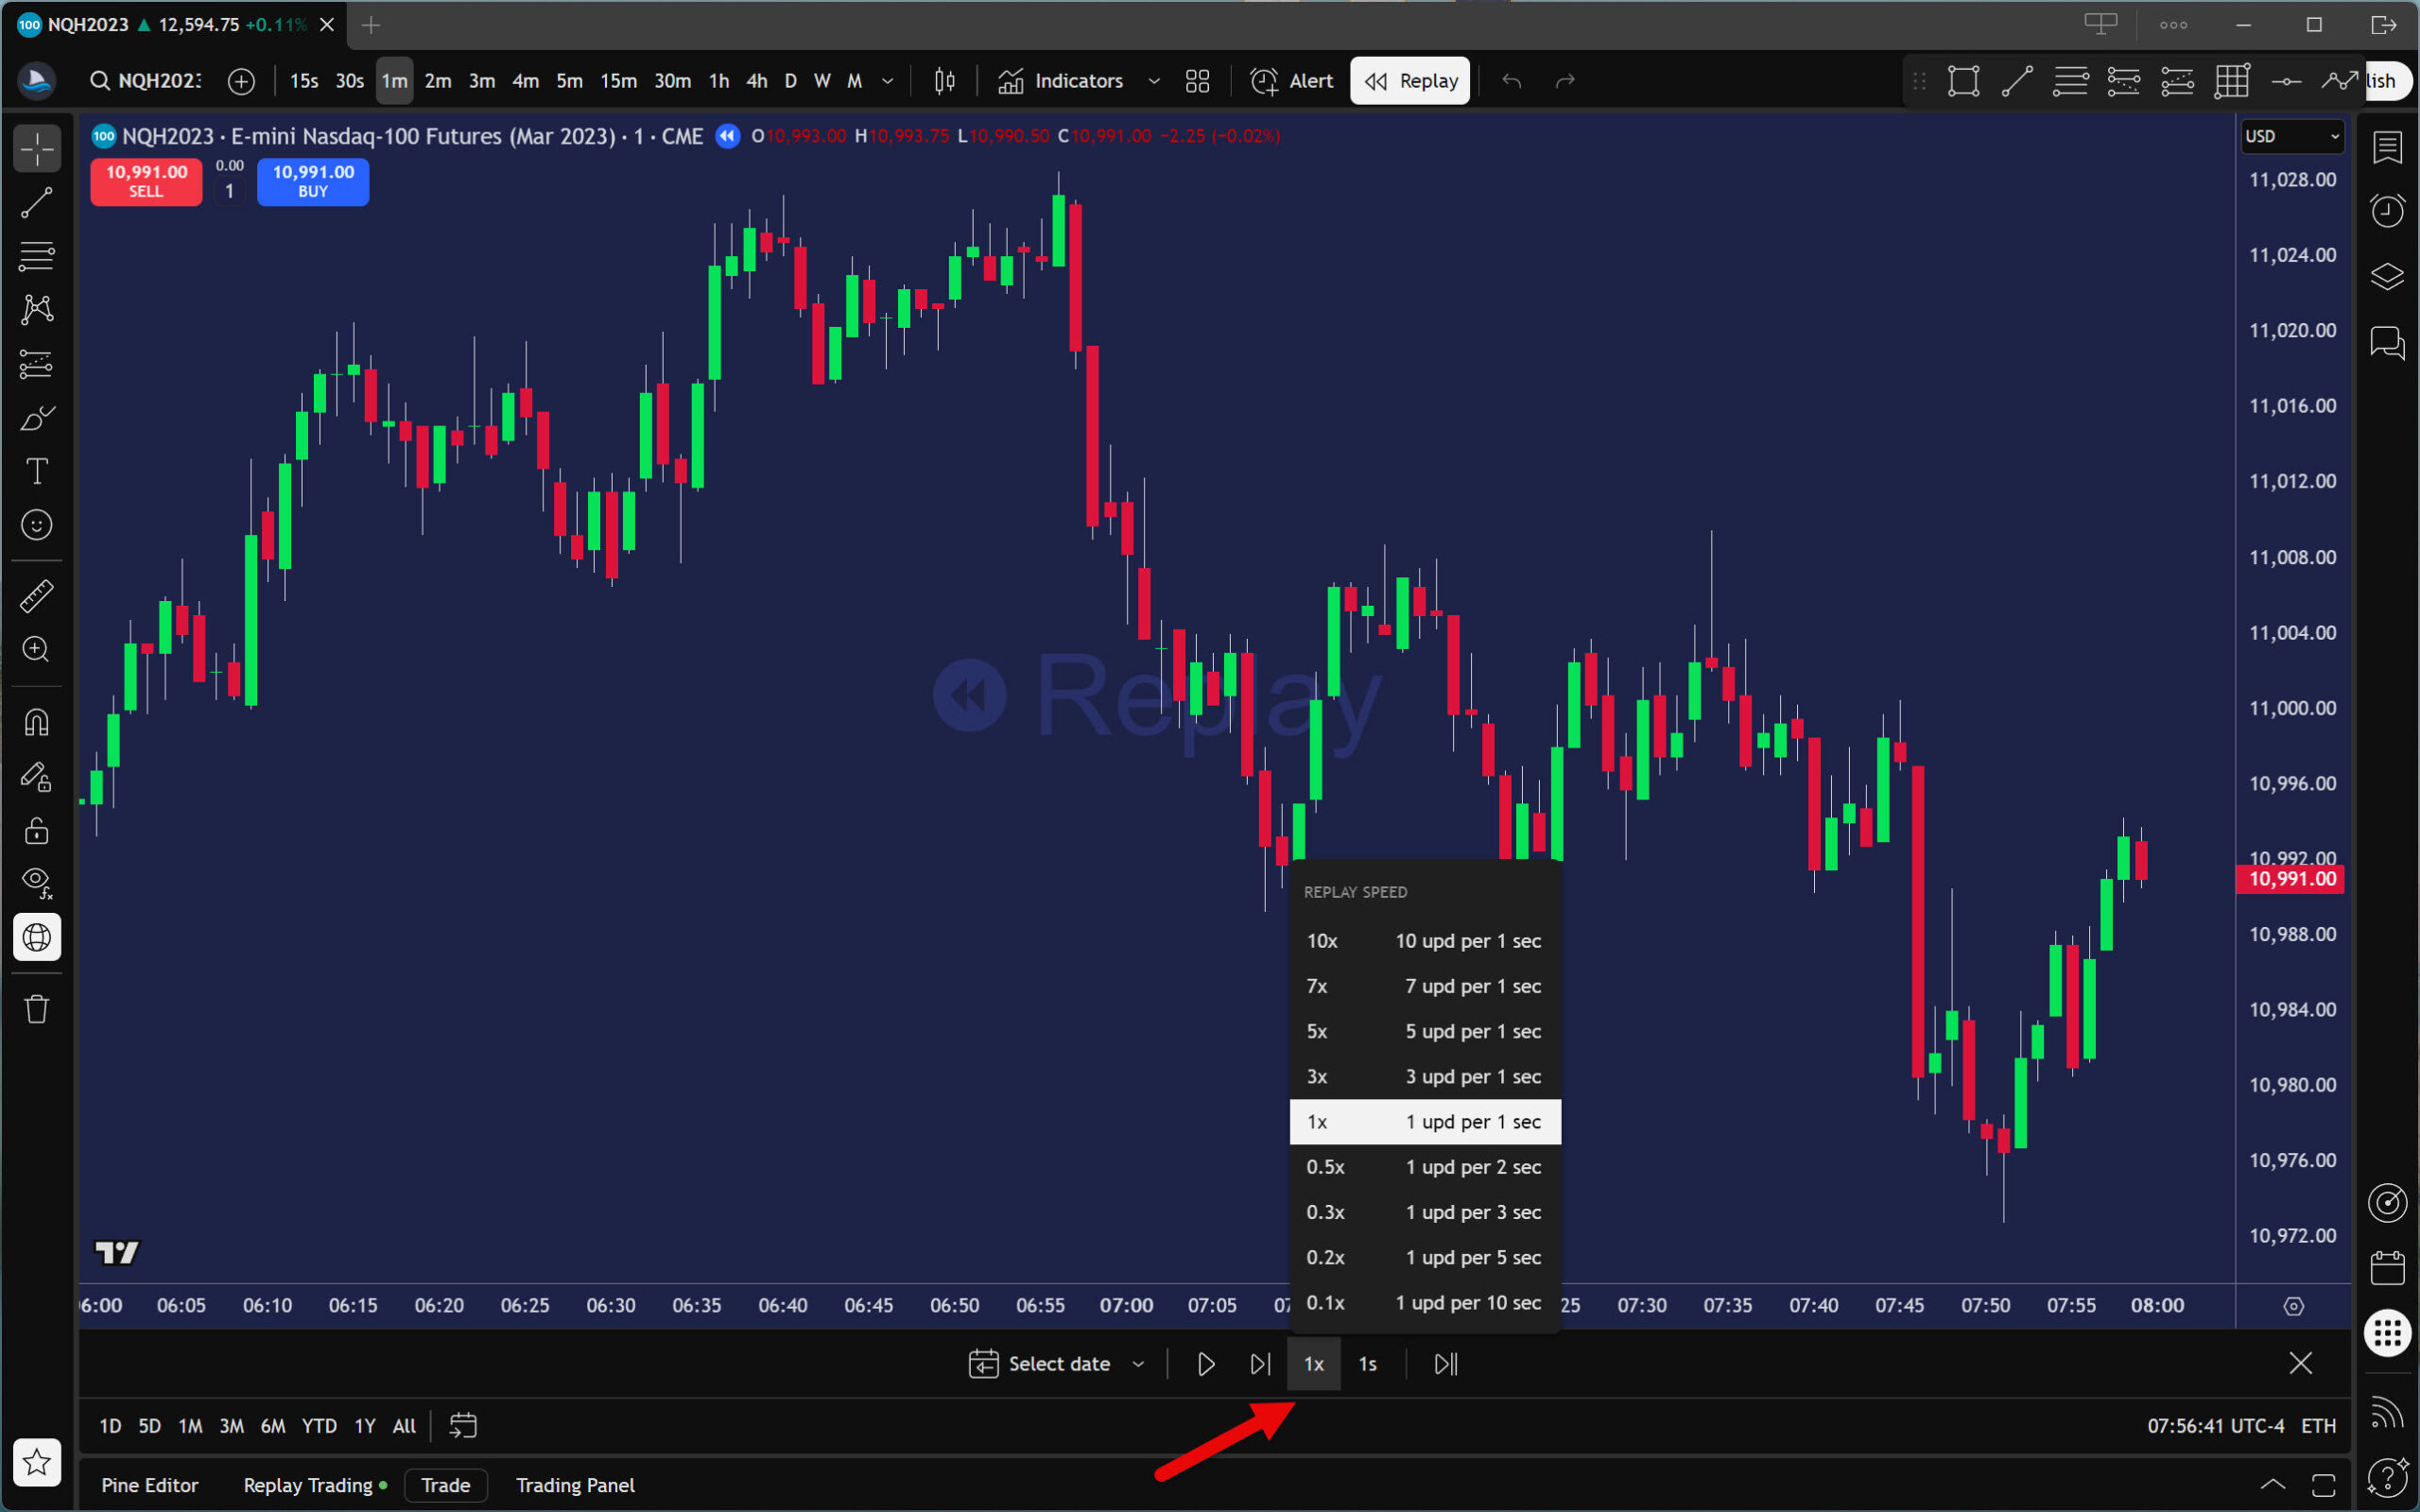
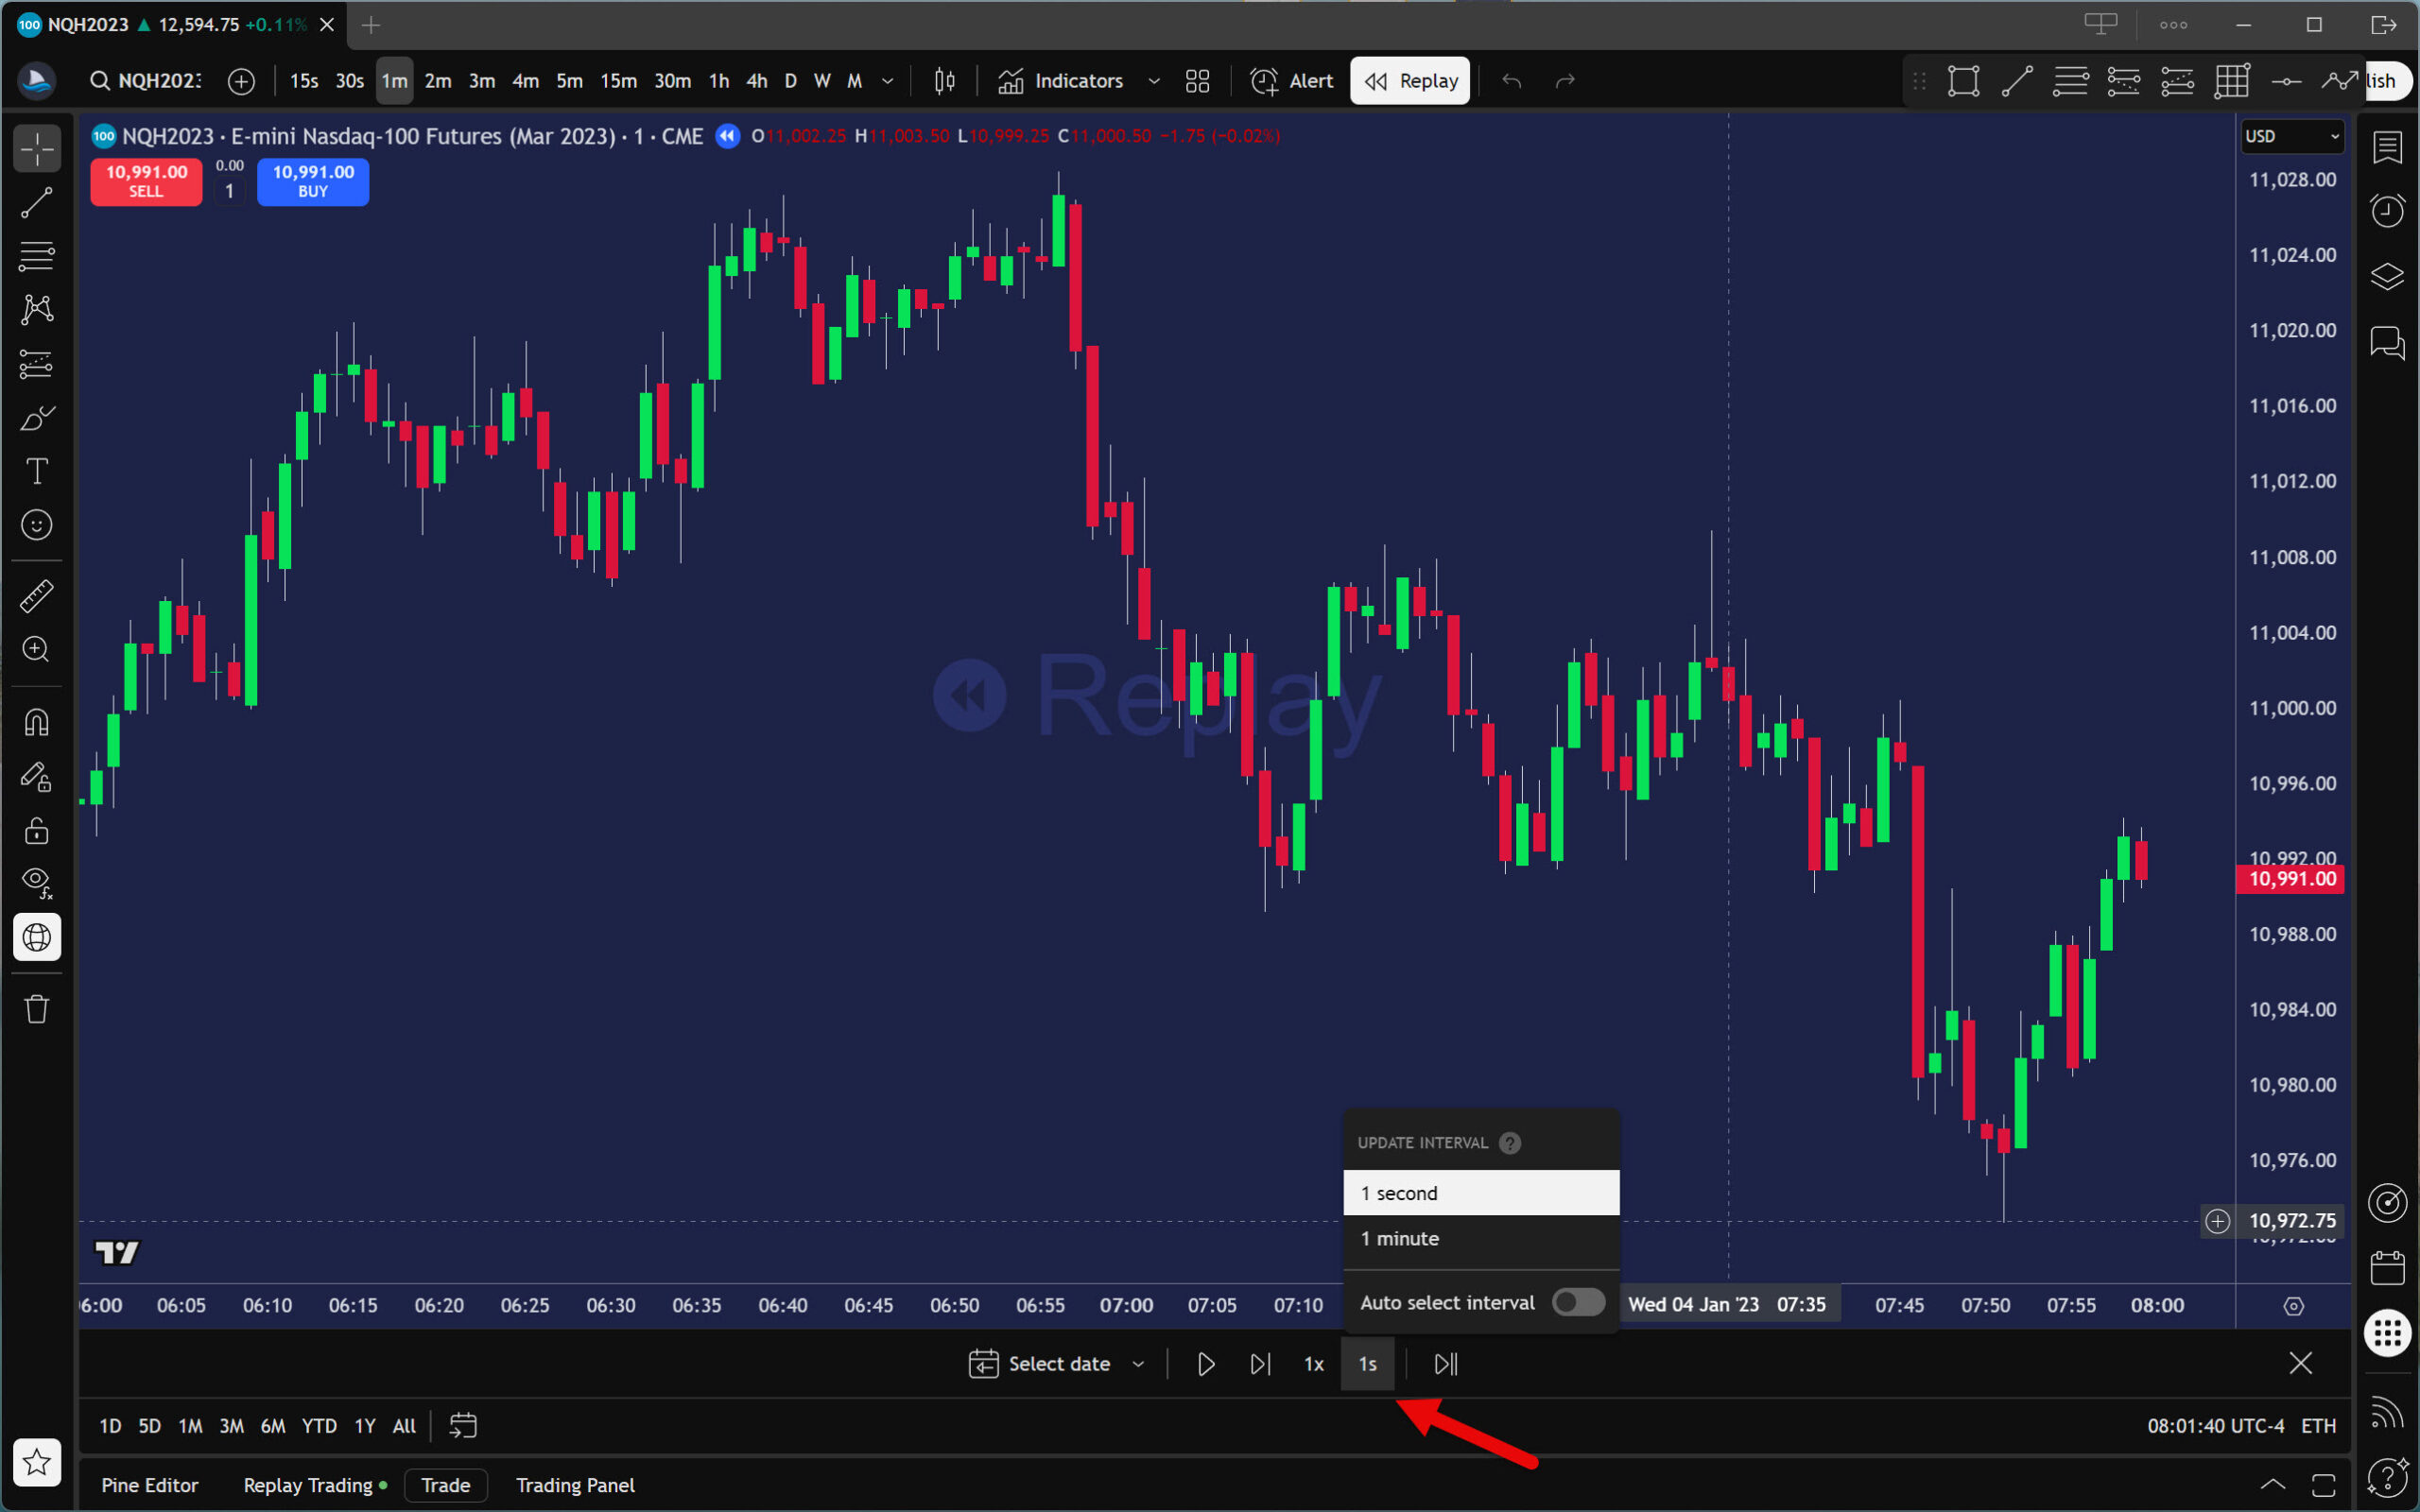
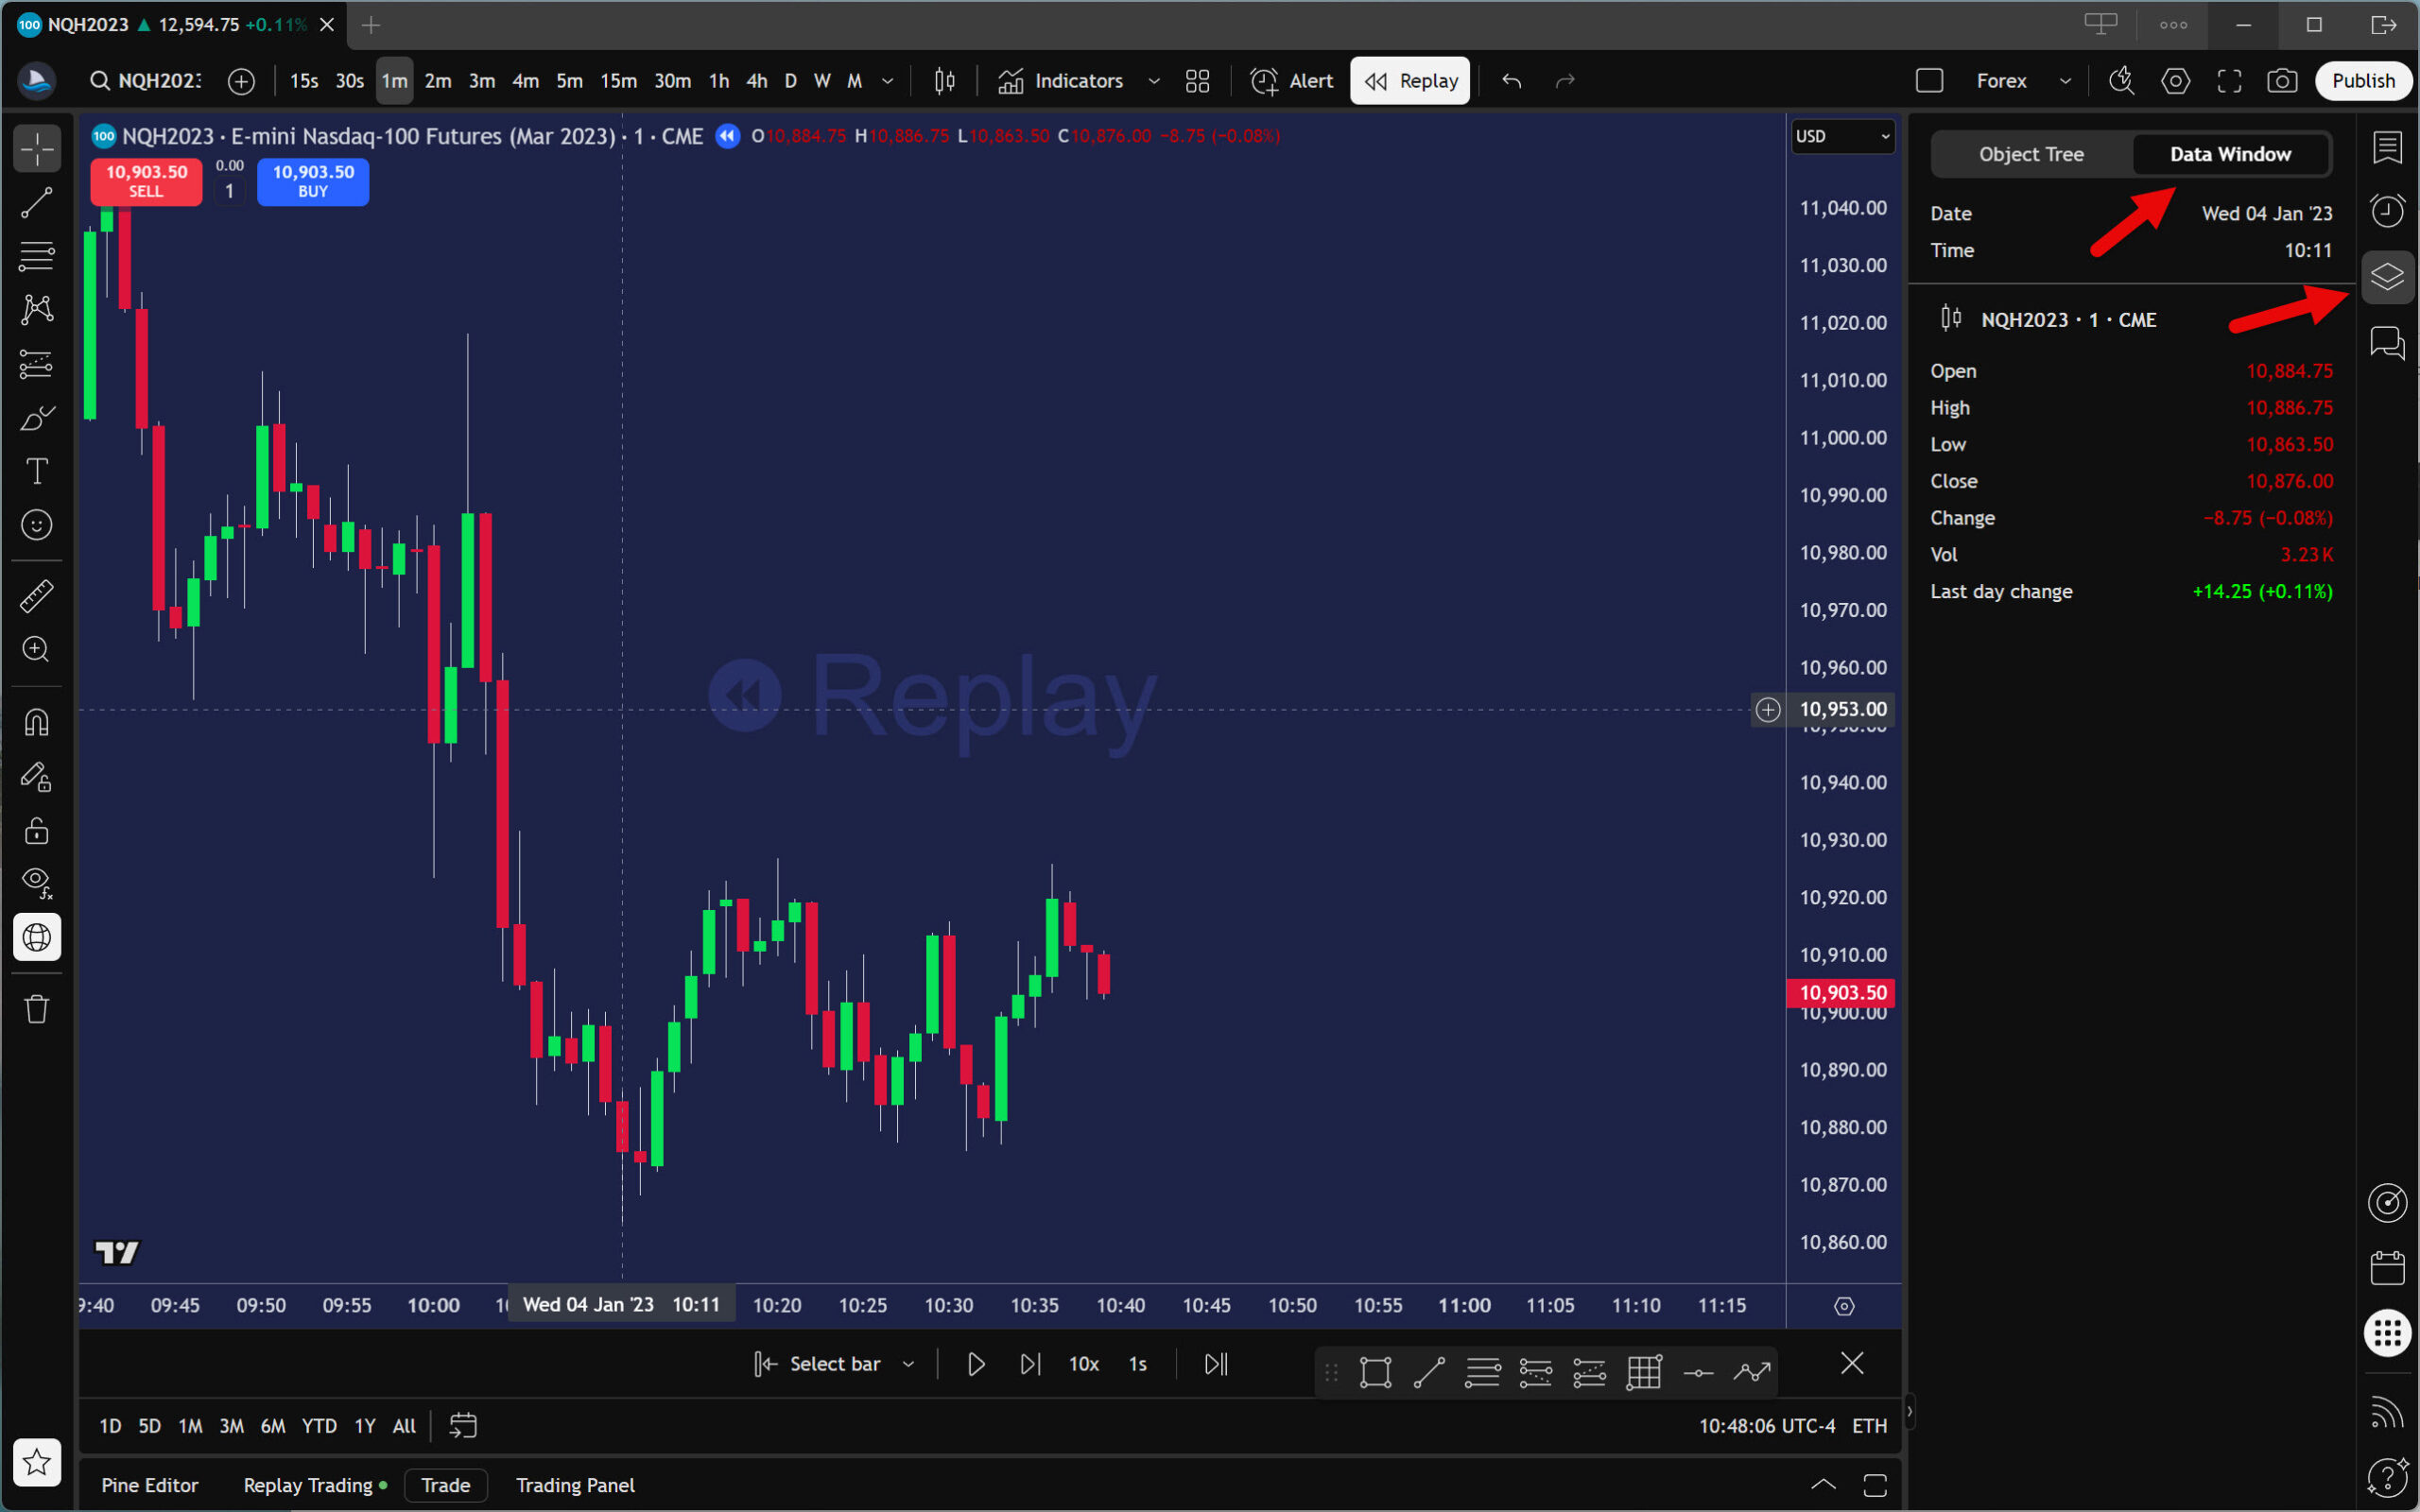
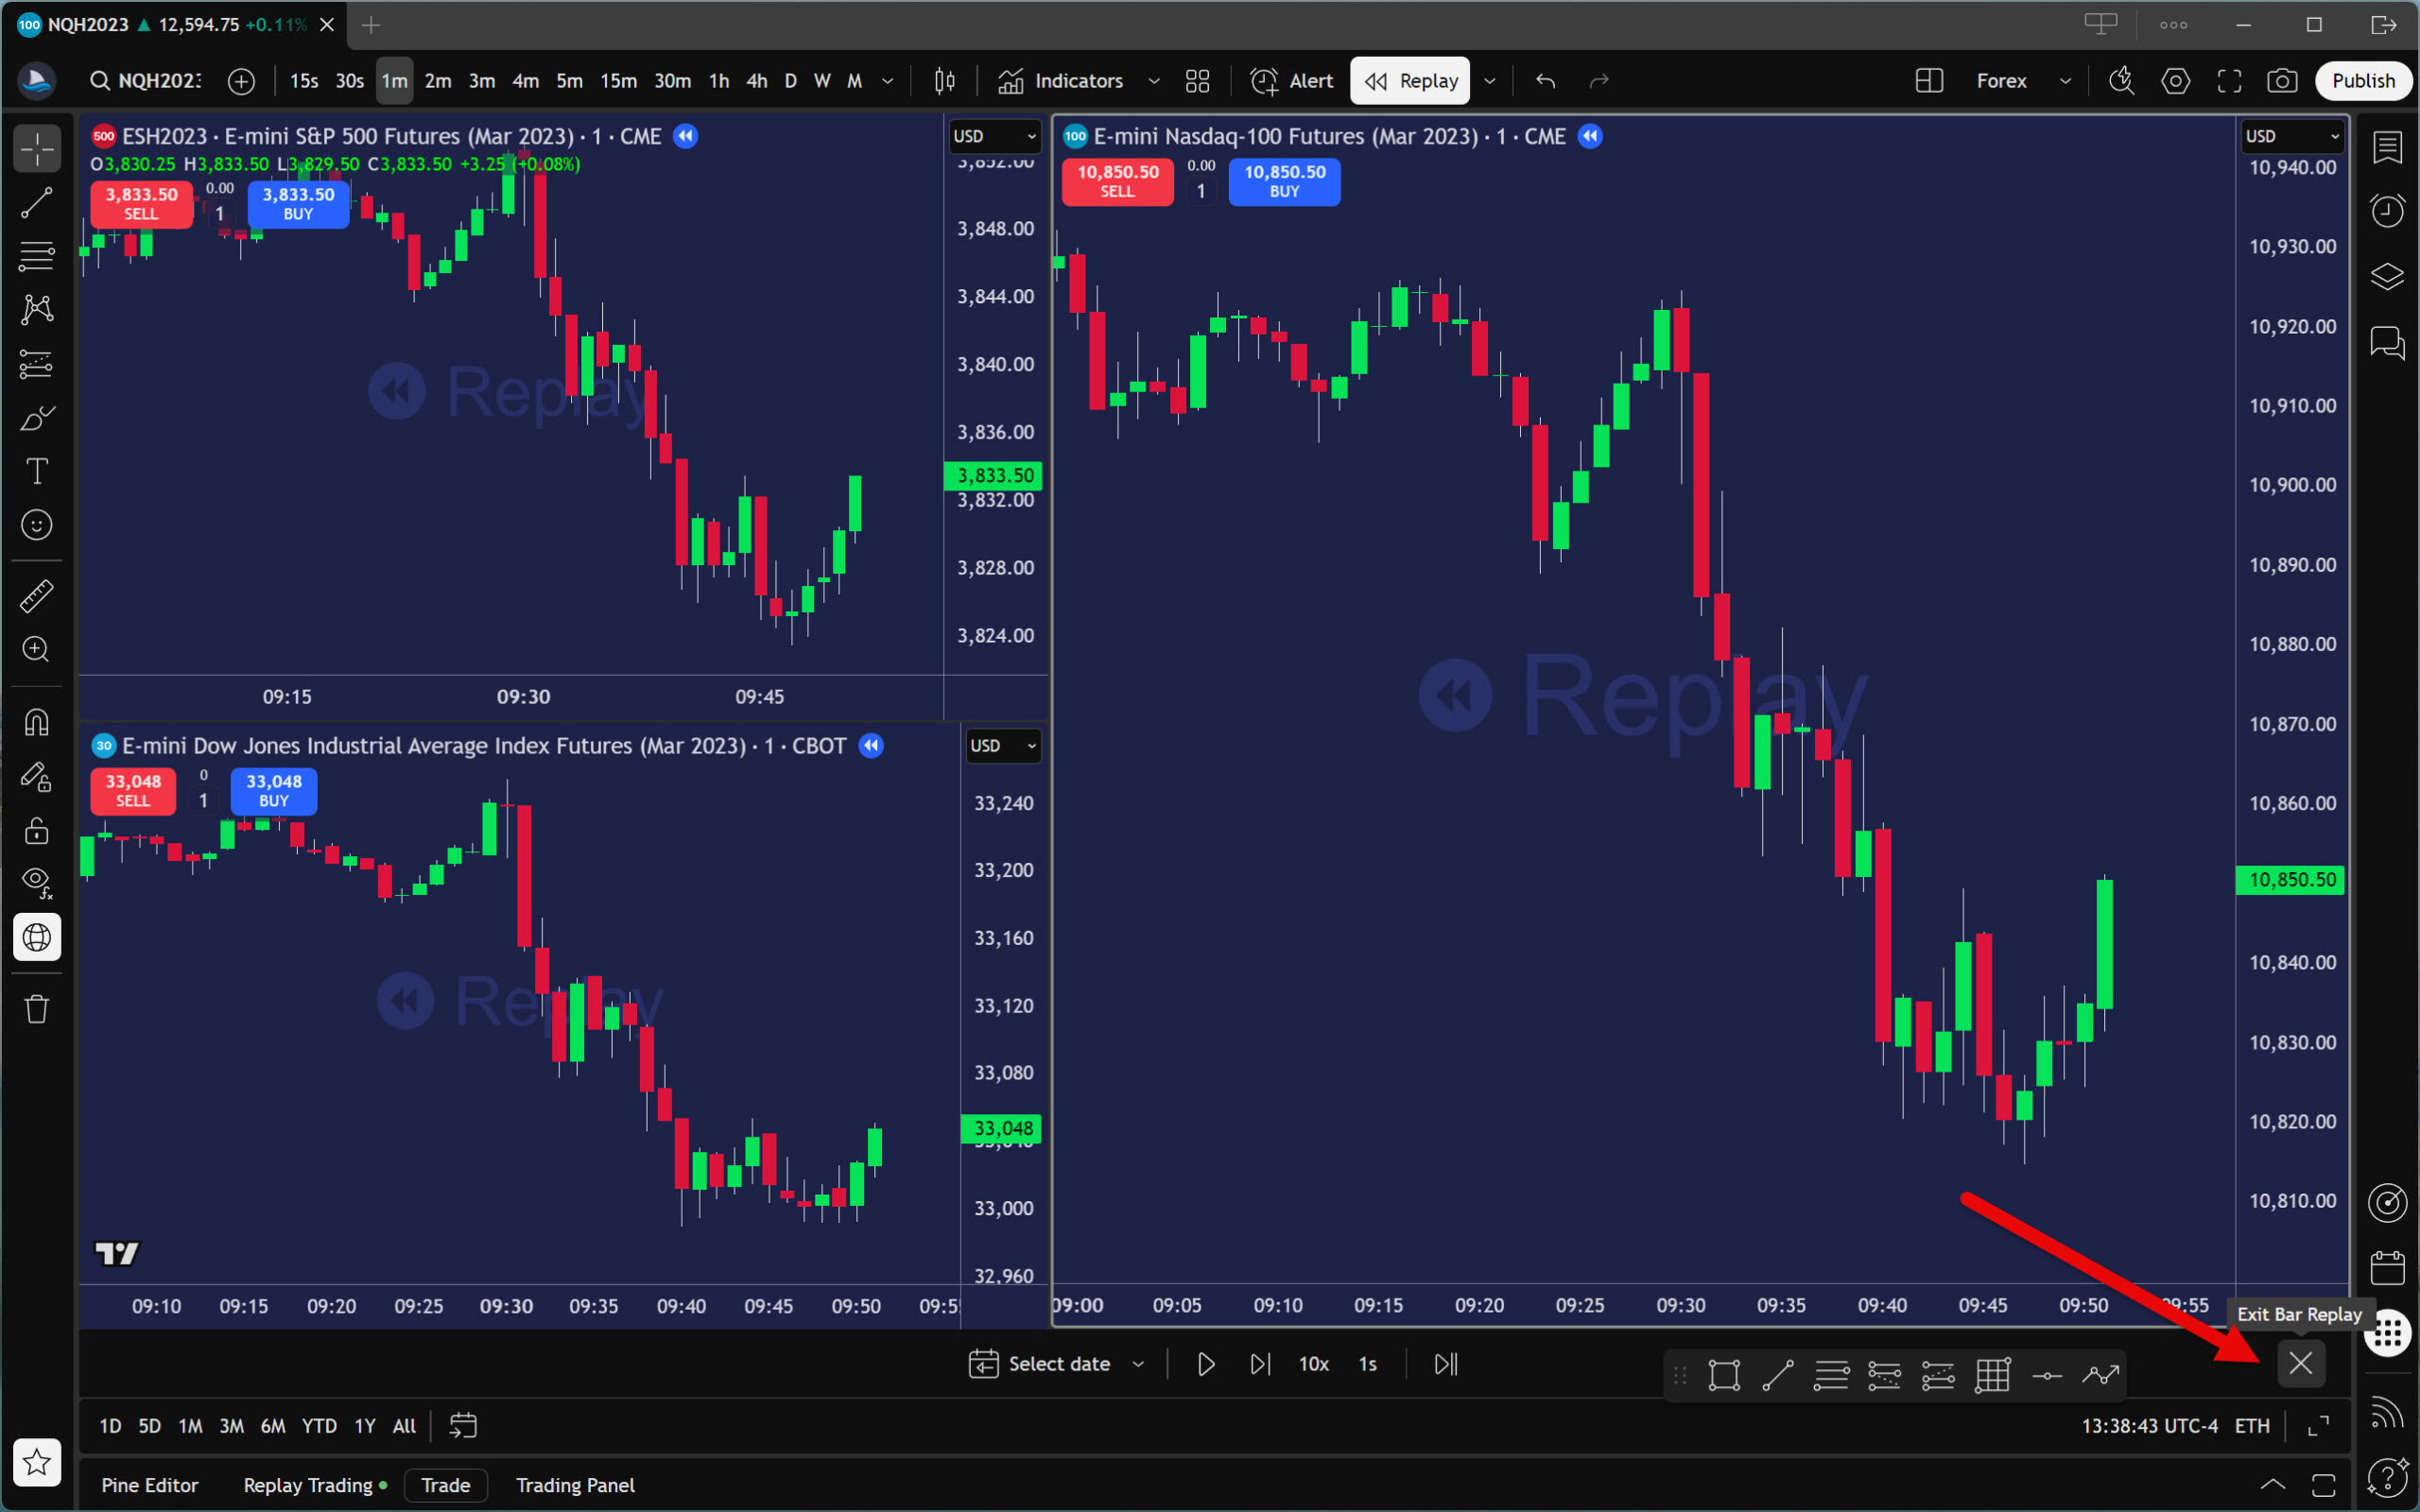
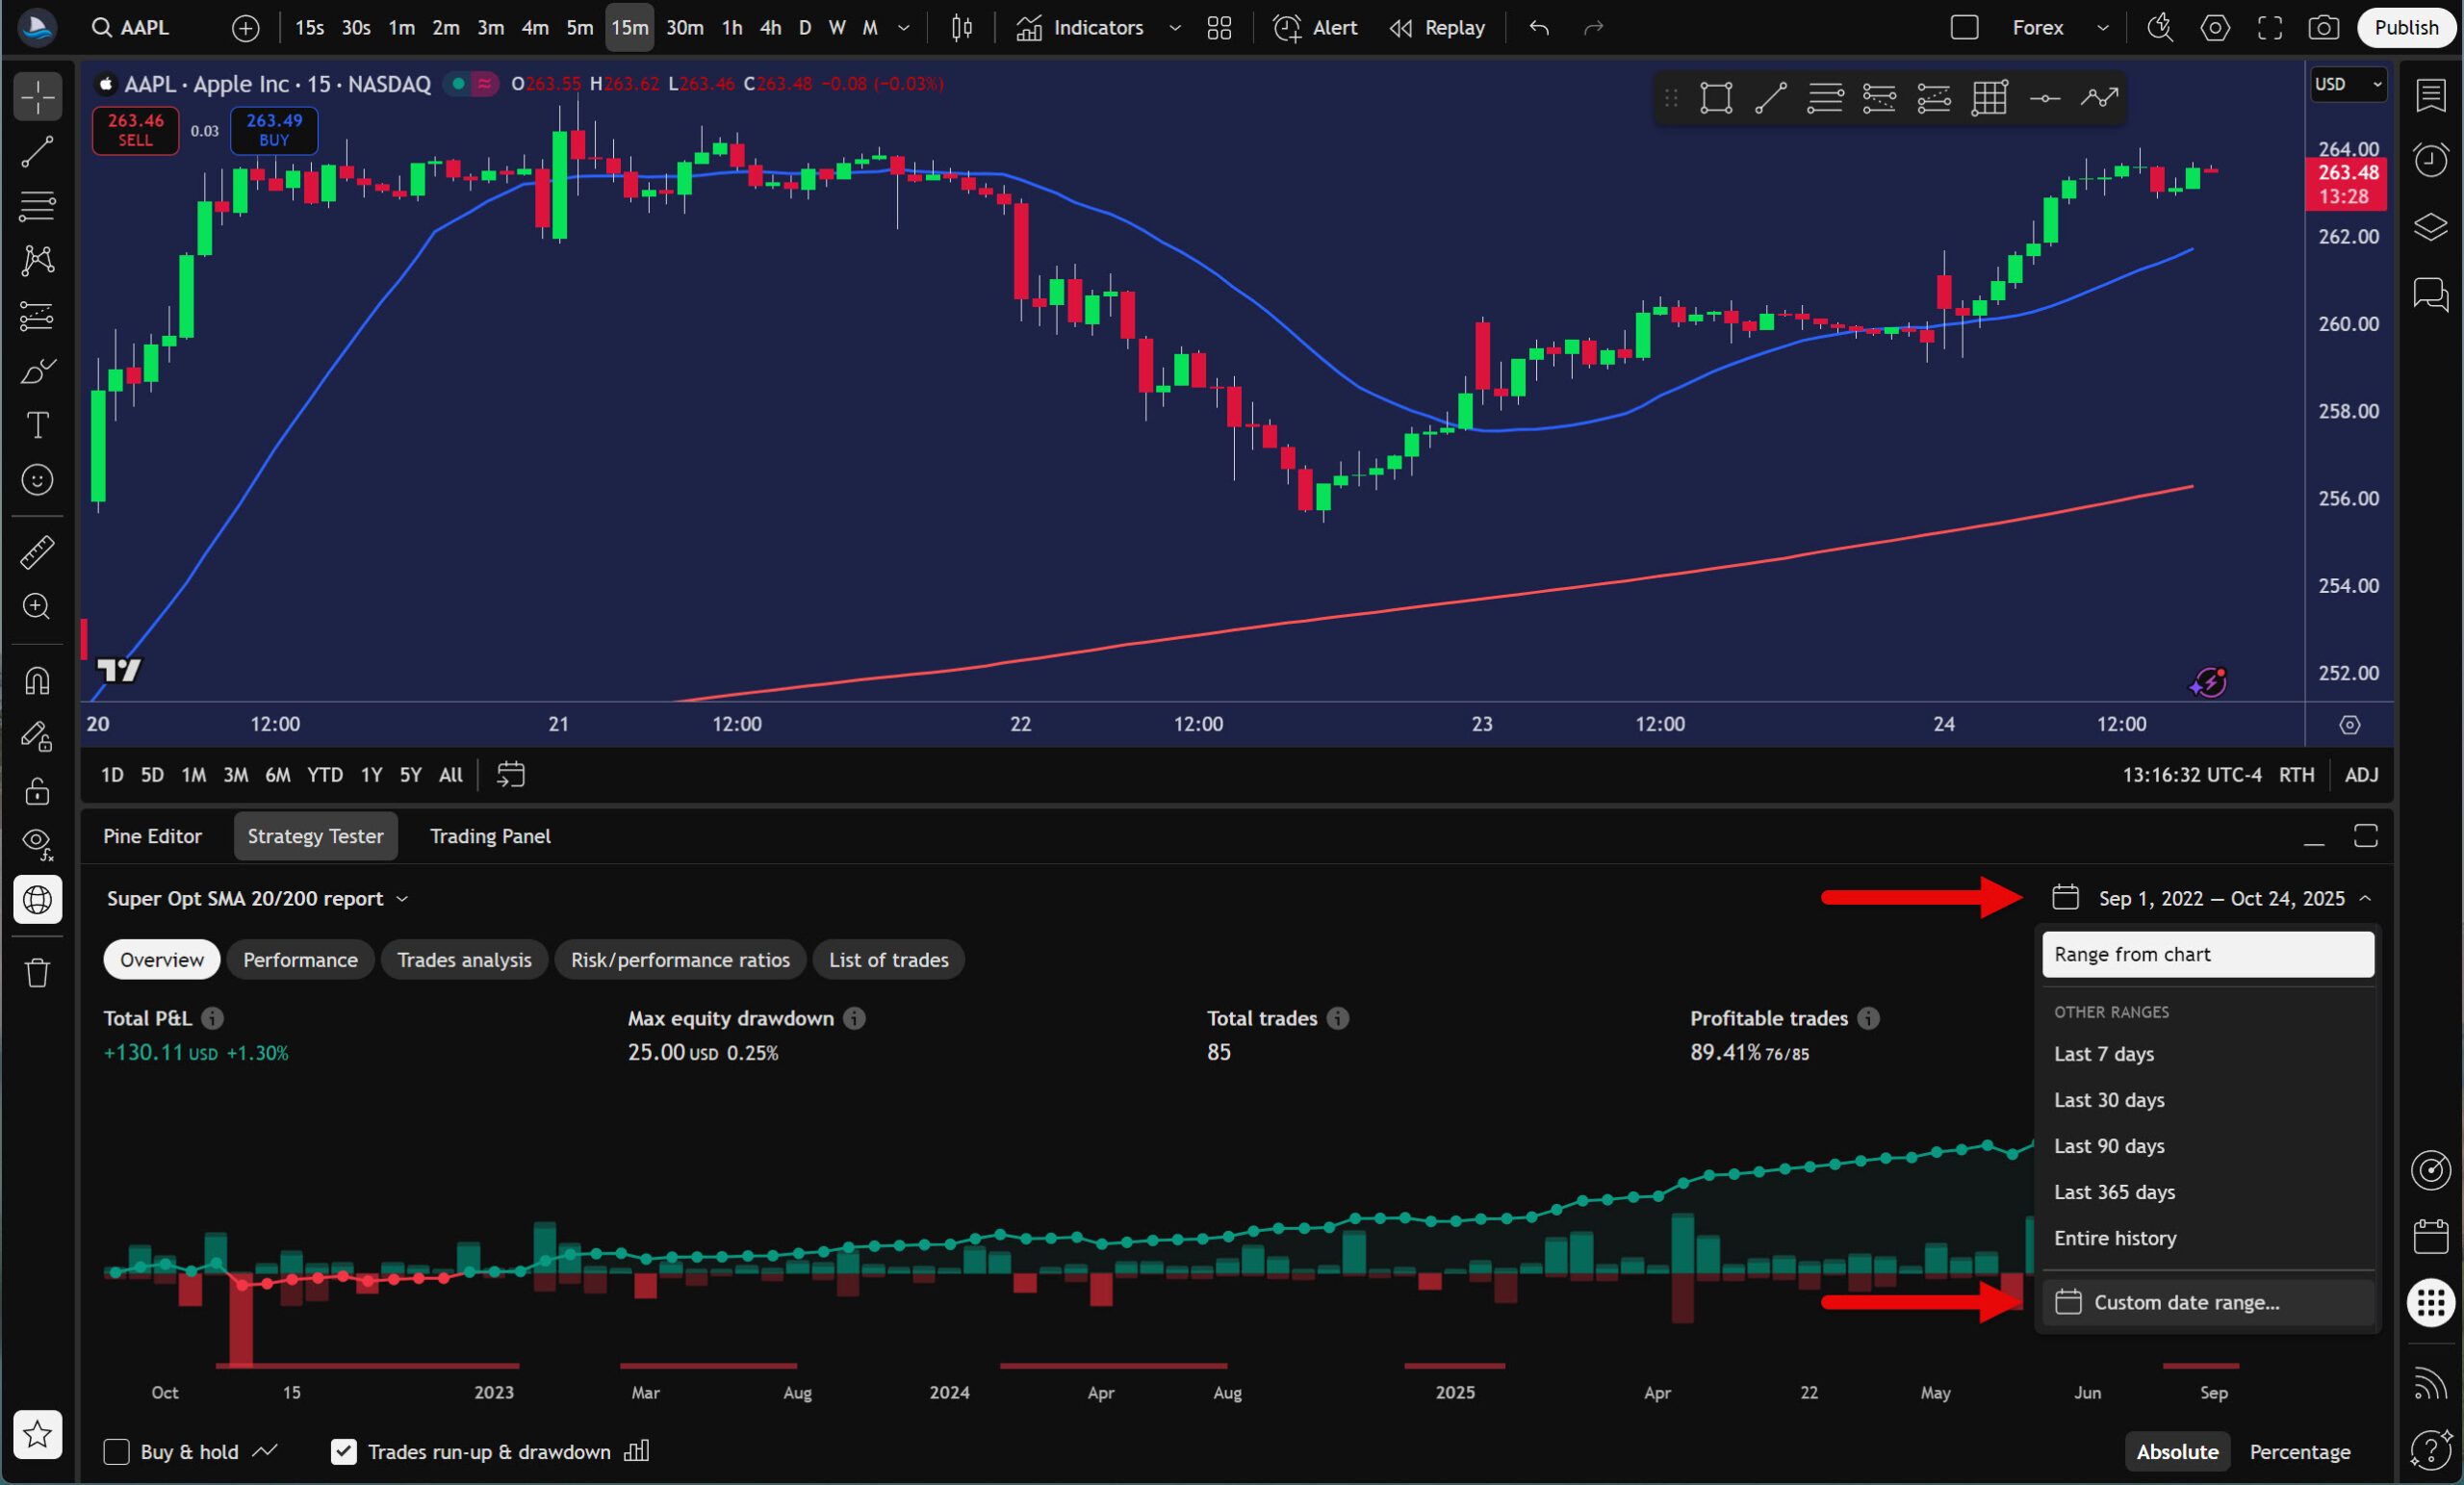
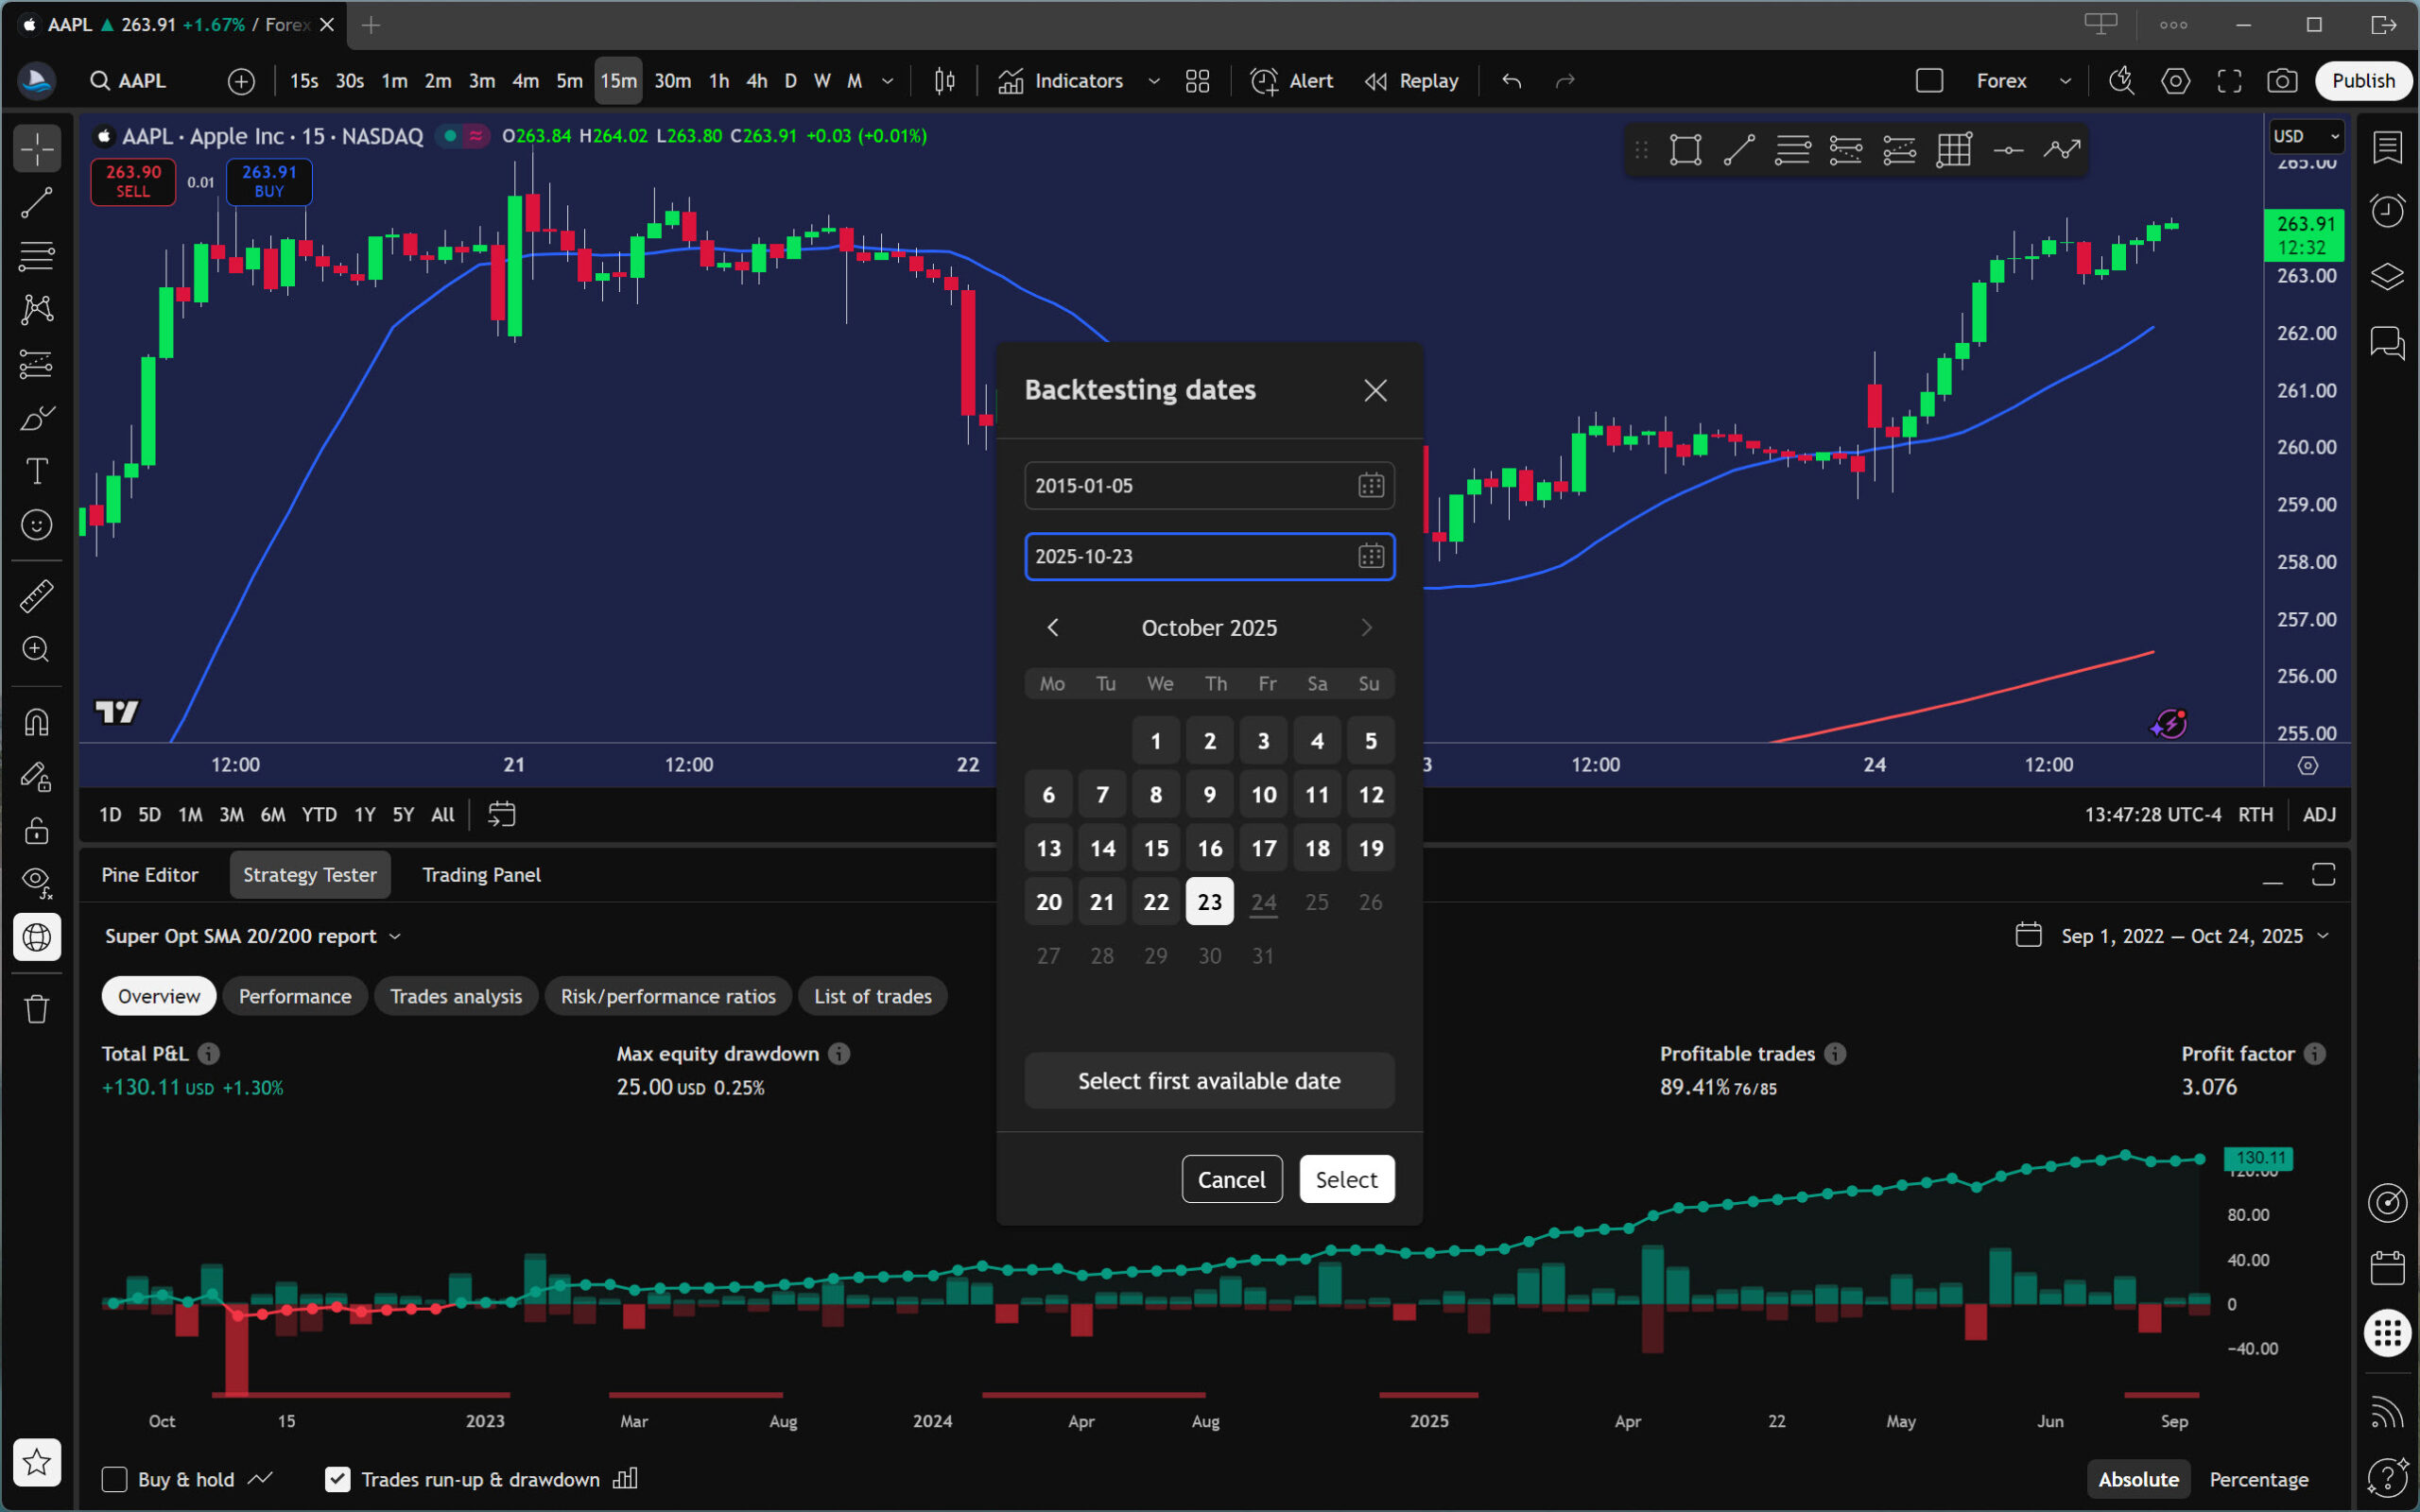
Determining the range of historical data is relatively simple. Start by selecting the instrument (market) and time frame for which you want to find the historical data depth. Then activate the Bar Replay tool and select the option Select the first available date. The chart will then move to the first point from which you can replay. This is the beginning of the historical data for the given time frame.

Does TradingView Strategy Tester provide reliable results?

The results produced by TradingView Strategy Tester depend heavily on the strategy’s entry and exit logic. For example, if the strategy uses the closing prices of the backtested time frame to evaluate entry or exit conditions, then the results are reliable.

However, if the strategy requires entry and exit conditions to be checked during candle (bar) creation, the results may not be entirely accurate, as the Strategy Tester has limited capabilities to do so.

For a deeper understanding of this issue, check out the Bar Magnifier article.

Conclusion

Now you know exactly how to backtest on the TradingView trading platform. You understand its current capabilities and limitations, and you have learned how to work with the Bar Replay tool and Strategy Tester. Regardless of whether you intend to backtest manually or automatically, you have all the necessary knowledge to start testing your strategies with this platform.

So put together your first trading plan, open your backtesting spreadsheet (if needed), and get started!

Picture of Daniel Jurnik
Daniel Jurnik
Hello! I'm Daniel, a trader and founder of the Backtesting Club community. Since 2007, my work has centered on discovering and developing various types of trading strategies focused on forex, stock, and futures markets. My trading philosophy emphasizes simple, systematic, and data-driven approaches that provide me with a strong edge in the markets. Over the years in this industry, I have gained extensive experience with discretionary and automated trading of scalping, intraday, and swing strategies. Now I'm helping novice and unsuccessful traders discover the real practices and principles that lead to profitable trading. If you want to take advantage of my knowledge and experience, join our club, where I share everything I know in a no BS format.
Share the Post: